You can estimate and predict the value of Y using a multiple regression equation. With multiple regression analysis, the population regression equation may contain any number of independent variables, such as
In this case, there are k independent variables, indexed from 1 to k.
For example, suppose that the Human Resources department of a major corporation wants to determine whether the salaries of its employees are related to the employees' years of work experience and their level of graduate education. To test this idea, the HR department picks a sample of eight employees randomly and records their annual salaries (measured in thousands of dollars per year), years of experience, and years of graduate education.
The following variables are defined:
Y represents an employee's annual salary, measured in thousands of dollars.
X1 represents an employee's number of years of job experience. A value of 0 represents someone who has no job experience (such as a recent college graduate).
X2 represents the number of years of graduate education. A value of 0 represents a college graduate with no graduate education.
The following table lists the sample data.
| Y (Annual Salary, in Thousands) | X1 (Years of Experience) | X2 (Years of Graduate Education) |
|---|---|---|
| 80 | 1 | 0 |
| 90 | 2 | 1 |
| 100 | 3 | 2 |
| 120 | 4 | 2 |
| 85 | 1 | 0 |
| 95 | 2 | 1 |
| 105 | 2 | 2 |
| 140 | 8 | 3 |
The HR department runs a regression using a spreadsheet program, such as Excel. This figure shows the results.
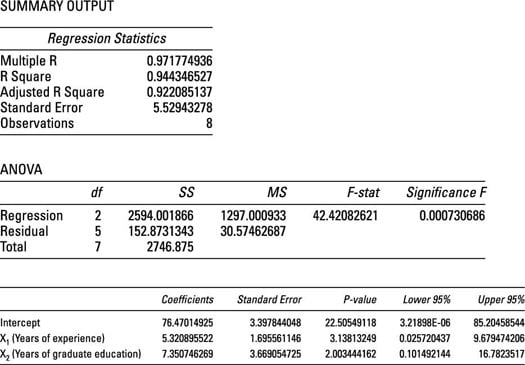
Taking the intercept and slope coefficients (X1 and X2) from the Coefficients column in the figure, you can fill in the estimated regression equation as
(The values are rounded to two decimal places.)
This equation shows that the following is true for this firm:
The starting salary for a new employee with no experience or graduate education is $76,470. This amount is based on the intercept of the regression equation.
Each additional year of experience adds $5,320 to an employee's salary; this amount is based on the coefficient of X1 (years of experience).
Each additional year of graduate education adds $7,350 to an employee's salary, which is based on the coefficient of X2 (years of graduate education).
In each case, you multiply the coefficients by $1,000 to get the impact on salary because these variables are measured in thousands of dollars per year.
The intercept of the equation, 76.47, shows the value of Y (the employee's annual salary) when both X1 (years of experience) and X2 (years of graduate education) equal 0 (that is, a new employee with no experience or graduate education). The intercept shows that the starting salary is
The coefficient of X1, 5.32, shows how much Y changes due to a one-unit change in X1. Because X1 represents years of experience, a one-unit change in X1 is one additional year of experience. Therefore, each additional year of experience adds
to an employee's salary.
The coefficient of X2, 7.35, shows how much Y changes due to a one-unit change in X2. Because X2 represents years of graduate education, a one-unit change in X2 is one additional year of graduate school. Therefore, each additional year of graduate school adds
to an employee's salary.
You can use the multiple regression equation for employee salaries to predict the annual salary of an employee with a specific amount of experience and education. For example, suppose that a randomly chosen employee has five years of experience and one year of graduate education. The predicted salary of this employee is
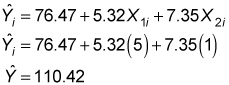
This result shows that the predicted annual salary is (110.42)($1,000) = $110,420.