To estimate a time series regression model, a trend must be estimated. You begin by creating a line chart of the time series. The line chart shows how a variable changes over time; it can be used to inspect the characteristics of the data, in particular, to see whether a trend exists.
For example, suppose you're a portfolio manager and you have reason to believe a linear trend occurs in a time series of returns to Microsoft stock. You plot the monthly prices from August 2008 to July 2013 on a graph like this one.
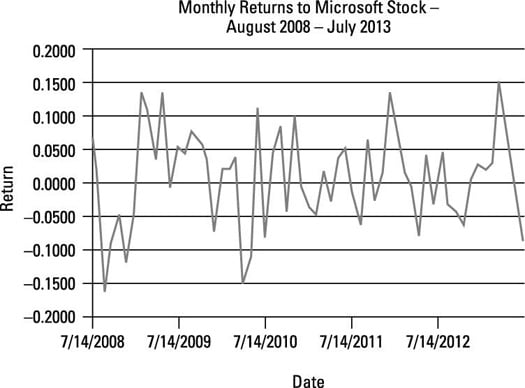
According to this figure, no trend occurs in the data. The returns rise and fall with no particular pattern.
To formally test whether a linear trend occurs, run a time series regression with a time trend as the independent variable, which you can set up like so:
In this example, the dependent variable is the price of Microsoft stock, and the independent variable is time (measured in months).
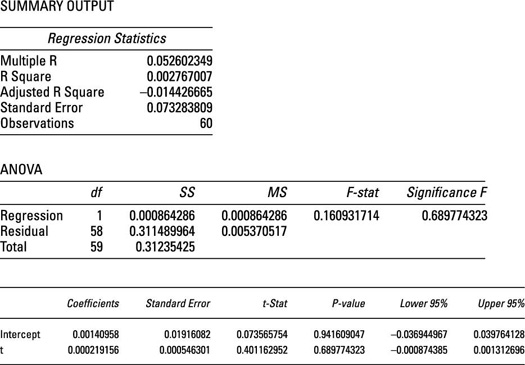
The next figure shows the results of this regression analysis.
To run this regression, the independent variable (time) is assigned numerical values as follows. You assign the first date in the sample a value of 1, the second date a value of 2, and so forth. So for this example, you assign August 2008 a value of 1, September 2008 a value of 2, and so on so that the last observation in the sample, July 2013, has a value of 60.
Note that in this figure, the coefficient of time is not statistically significant; its p-value is approximately 0.6898. For many hypothesis tests, as a rule of thumb any p-value above 0.05 indicates that a variable is not statistically significant.
More formally, the null hypothesis
can't be rejected at the 5 percent level of significance. This means there isn't enough evidence to show there is a trend in the data.
When there's no trend, the value of
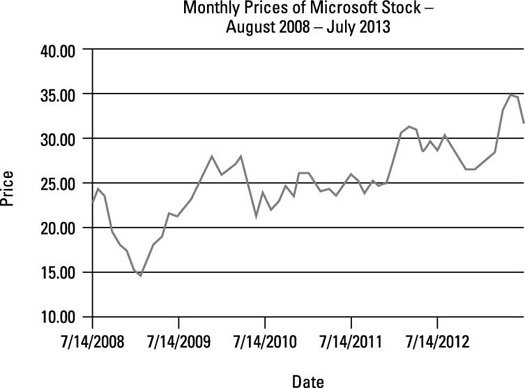
As another example, suppose that instead of estimating a linear trend for the returns to Microsoft stock, you estimate a linear trend for the price of Microsoft stock. The following figure shows a plot of monthly Microsoft stock prices from August 2008 to July 2013.
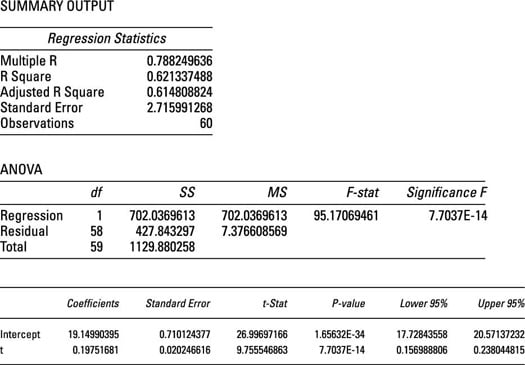
The following figure shows the results of running a regression of the price of Microsoft stock against time with an assumed linear trend.
The results show that the time variable is statistically significant at the 5 percent level (because the p-value for time is well below 0.05). Based on the coefficients in the figure, the estimated regression equation is
(Note that the coefficients are rounded in this equation.) This equation shows that during the sample period, the price of Microsoft stock grew by an average of $0.1975 per month because 0.1975 is the coefficient of t, and y is measured in dollars.
Suppose that in your role as portfolio manager you want to determine whether a quadratic trend occurs in the time series of Microsoft stock prices.
If there is a quadratic trend in a time series, the appropriate regression equation is
There is one new term in this equation:
Because time is squared here, this term captures the curvature of the trend. If this term is statistically significant, the trend associated with this time series is said to have a quadratic trend.
The next figure shows the results of running this regression.
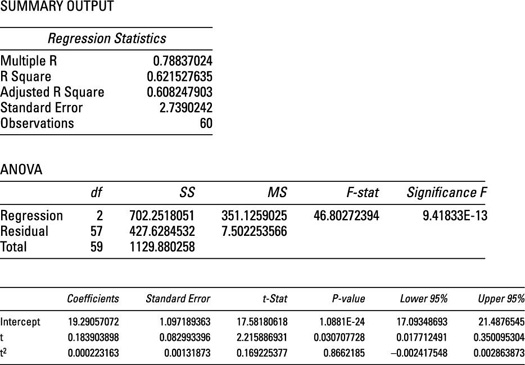
This figure shows that the coefficient of time (t) is statistically significant, whereas the coefficient of time squared (t2) is not, indicating that there is not a quadratic trend in the data, but there is a linear trend. Therefore, the price of Microsoft stock should be forecast with the linear trend model: