Two of the most widely used measures of association are covariance and correlation. These measures are closely related to each other; in fact, you can think of correlation as a modified version of covariance.
Correlation is easier to interpret because its value is always between –1 and 1. For example, a correlation of 0.9 indicates a very strong relationship in which two variables nearly always move in the same direction; a correlation of –0.1 shows a very weak relationship in which there is a slight tendency for two variables to move in opposite directions.
With covariance, there is no minimum or maximum value, so the values are more difficult to interpret. For example, a covariance of 50 may show a strong or weak relationship; this depends on the units in which covariance is measured.
Correlation is a measure of the strength and direction of two related variables. Two variables are said to be related if they can be expressed with the following equation:
Y = mX + b
X and Y are variables; m and b are constants. For example, suppose that the relationship between two variables is:
Y = 3X + 4
In this case, 3 is the coefficient of X, which means that an increase of X by 1 causes Y to increase by 3. Equivalently, a decrease of X by 1 causes Y to decrease by 3. The 4 in this equation indicates that Y equals 4 when X equals 0.
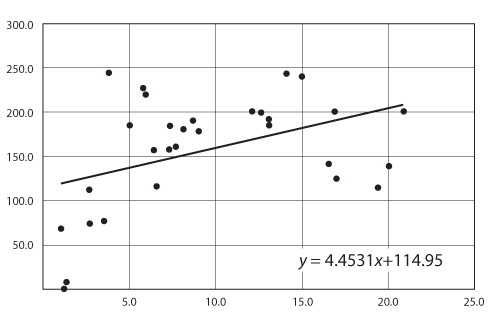
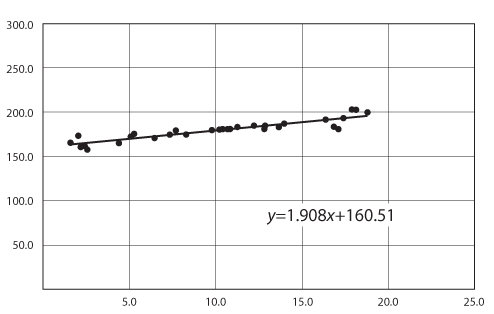
Note that even though correlation can be computed for any pair, this doesn't mean they are linearly related. For example, you could have a high correlation with a small slope, and a low correlation with a large slope, as shown in the following graphs.
Covariance and correlation show that variables can have a positive relationship, a negative relationship, or no relationship at all. With covariance and correlation, there are three cases that may arise:
If two variables increase or decrease at the same time, the covariance and correlation between them is positive. For example, the covariance and correlation between the stock prices of two oil companies is positive because many of the same factors affect the stock prices in the same way.
If two variables move in opposite directions, the covariance and correlation between them is negative. For example, the covariance and correlation between interest rates and new home sales is negative because rising interest rates increase the cost of purchasing a new home, which in turn reduces new home sales. The opposite occurs with falling interest rates.
If two variables are unrelated to each other, the covariance and correlation between them is zero (or very close to zero). For example, the covariance and correlation between gold prices and new car sales is zero because the two have nothing to do with each other.