
Graphing is one way of getting the characteristics of a function out there for everyone to see. The basic graphs are just that — basic. They’re centered at the origin and aren’t expanded or shrunken or jostled about. You can alter the basic graphs by performing translations to the left or right or up or down.
The quadratic polynomial graph
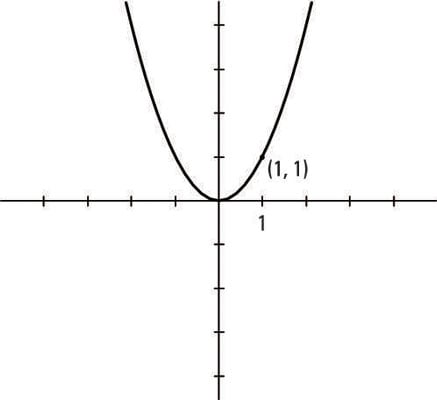
The graph of a polynomial function is a smooth curve that may or may not change direction, depending on its degree. The quadratic, y = x2, is one of the two simplest polynomials.
The cubic polynomial graph
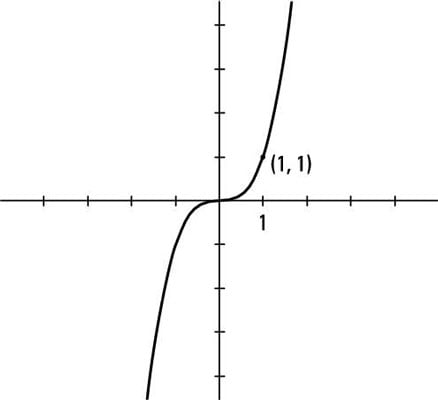
The cubic, y = x3 is another simple polynomial. Both the cubic and the quadratic go through the origin and the point (1, 1).
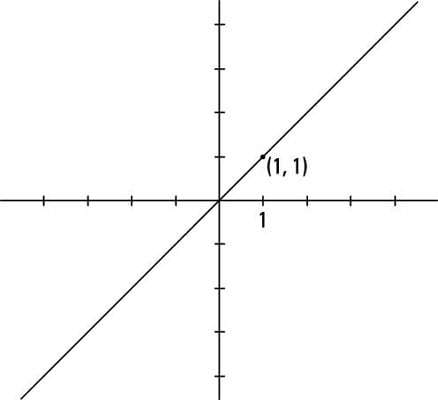
The graph of the line y = x
Just two points determine a unique line. This statement means that only one line can go through any two designated points.
Lines can have x– and y-intercepts — where the lines cross the axes; the slope of a line tells whether it rises or falls and how steeply this happens. As the figure shows, the graph of the line y = x goes diagonally through the first and third quadrants. The slope is 1, and the line goes through the point (1, 1). The only intercept of this line is the origin.
The absolute value function
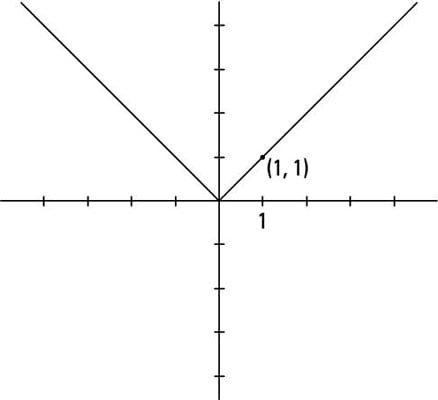
The absolute value function y = |x| has a characteristic V shape. The V is typical of most absolute value equations with linear terms. The only intercept of this basic absolute value graph is the origin, and the function goes through the point (1, 1).
The reciprocal of x
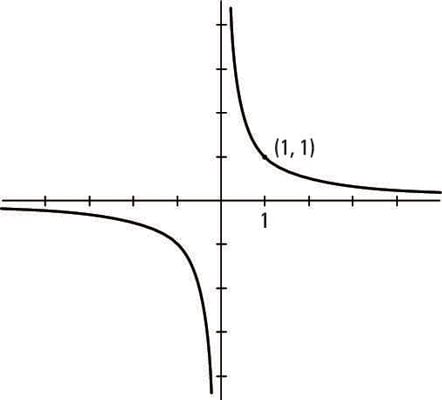
The graphs of y = 1/x and y = 1/x2 both have vertical asymptotes of x = 0 and horizontal asymptotes of y = 0. The asymptotes are actually the x– and y-axes. Each curve goes through the point (1, 1), and each curve exhibits symmetry. The graph of y = 1/x is symmetric with respect to the origin (a 180-degree turn gives you the same graph).
The reciprocal of x2
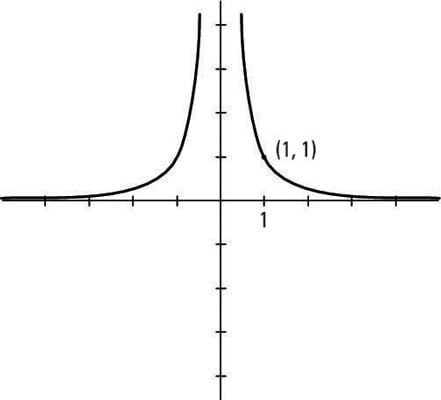
The graph of y = 1/x2 is symmetric with respect to the y-axis (it’s a mirror image on either side).
The graph of the square root
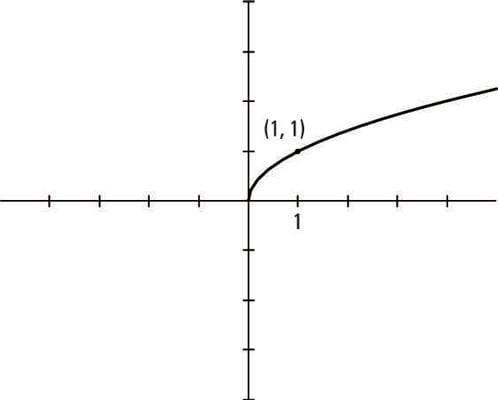
The graph of y = the square root of x starts at the origin and stays in the first quadrant. Except for (0, 0), all the points have positive x– and y-coordinates. The curve rises gently from left to right.
The graph of the cube root
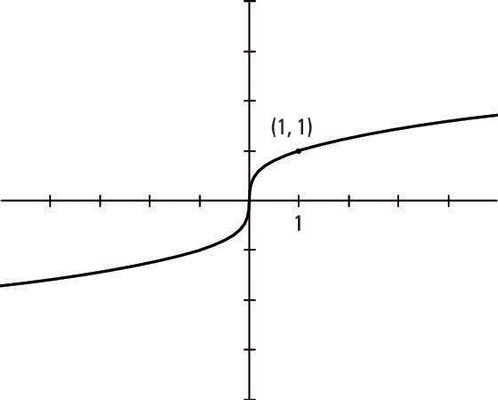
The graph of y = the cube root of x is an odd function: It resembles, somewhat, twice its partner, the square root, with the square root curve spun around the origin into the third quadrant and made a bit steeper. You can take cube roots of negative numbers, so you can find negative x- and y- values for points on this curve.
Both curves go through the point (1, 1).
The graph of the exponential function
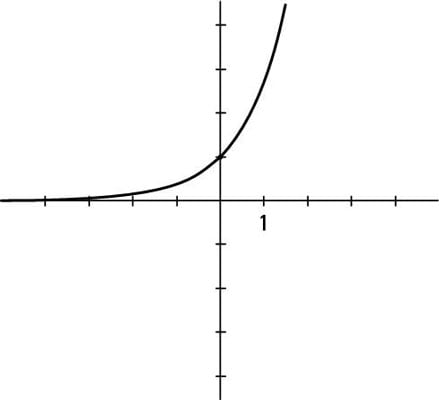
The graph of the exponential function y = ex is always above the x-axis. The only intercept of this graph is the y-intercept at (0, 1). The x-axis is the horizontal asymptote when x is very small, and the curve grows without bound as the x-values move to the right.
The graph of the logarithmic function
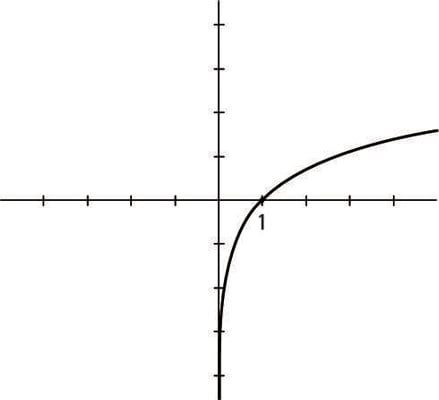
The graph of the logarithmic function y = ln x is the mirror image of its inverse function, y = ex, over the line y = x. The function has one intercept, at (1, 0). The graph rises from left to right, moving from the fourth quadrant up through the first quadrant. The y-axis is the vertical asymptote as the values of x approach 0 — get very small.