
On the TI-Nspire, categorical data can be represented in two modes of statistical plotting, raw data and summary data. Raw data is contained in one list. Summary data contains separate lists. In this first example, you will use raw data to plot the favorite seasons of a group of students.
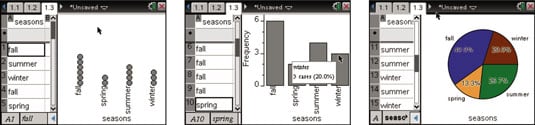
Categorical data requires the use of string values. To type a string into a cell, you can enclose the characters in quotation marks. However, in the first screen, quotes weren't used when typing in column A, and TI-Nspire still treated the data as categorical in nature.
To switch the plot to a bar chart, press [MENU]→Plot Type→Bar Chart. The second screen shows a bar chart of the favorite seasons data. Notice that you can click a bar to reveal the number of cases and the corresponding percent for the selected category.
The data defaults to an alphabetical order (Fall, Spring, Summer, and Winter). However, you can grab ([CTRL][CLICK]) the labels and use your Touchpad to move the labels if you want to change the order of the display.
For example, grab the word fall and move the data column to change the order of the chart. The order: Spring, Summer, Fall, and Winter may make more sense in the given context. Additionally, you can right-click on the chart, [CTRL][MENU]→Sort, and choose one of three options: List Order, Value Order, and Alpha Order.
Categorical case data can also be represented as a pie chart. Press [MENU]→Plot Type→Pie Chart to switch to a pie chart. The third screen shows the pie chart of my favorite seasons data. Once again, you can click a sector to reveal the number of cases and the corresponding percent for the selected sector.
To show the percentages on the pie chart, right-click, [CTRL][MENU]→Show All Labels. Of course, if you don’t want to see the percentages of each sector, right-click, [CTRL][MENU]→Hide All Labels.
Perhaps your categorical data is given in summary data form. That is, one column gives the category name and a second column gives the frequency of occurrence. On TI-Nspire, you can graph this data using a summary plot.
To graph a summary plot, follow these steps:
Highlight the column containing the category names.
Press [MENU]→Data→Summary Plot.
A dialog box appears.
Select the list name containing the frequency values and press [ENTER] (see the second screen).
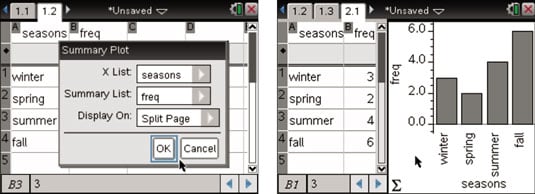
Change the categorical split data to a pie chart by pressing [MENU]→Plot Type→Pie Chart or right-click and choose Pie Chart.