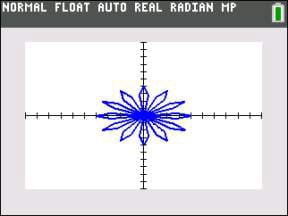
After you have set the window and entered the polar equation, graphing the equations on your TI-84 Plus is easy. Before you press [GRAPH], make sure you watch the direction as your graph is created. If your θstep is small enough, you should be able to see the graph develop.
Press [GRAPH].
Using Zoom to change the window
If the graphing window is not to your liking, you can use any of the Zoom commands. Here are the steps that to get a nice window for the polar graph.
Press [ZOOM][1], use the arrow keys to position your cursor above and left of your graph, press [ENTER], and use the arrow keys to reposition your cursor below and right of your graph.
See the first screen.
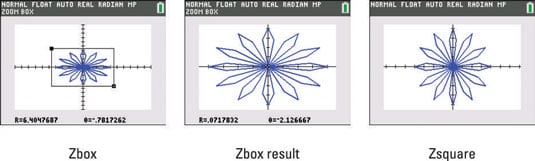
Press [ENTER].
See the result of ZBox in the second screen.
Press [ZOOM][5].
See the result of Zsquare in the third screen.
Sometimes you try a Zoom command and don’t particularly like the result. No worries! Press

and [ENTER] to invoke the ZPrevious command and return to whatever zoom you last used.
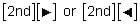
Using Trace to evaluate a polar equation
Using the Trace feature to evaluate polar equations can be easily managed. If your Format is set to Polar GC, you will find r-values when you trace the polar graph. If your Format is set to Rect GC, you will find the rectangular coordinates (x,y) of the points that make up your polar graph.
Follow these steps to evaluate a polar equation at specific θ values:
Press [TRACE].
See the first screen. Your trace starts at the θmin value as defined in the Window editor. The value of r is displayed in the border at the bottom of your graph screen.
The TI-84 Plus C displays functions and information in the border of the graph screen. The TI-84 Plus displays similar information directly on the graph screen.
After pressing [TRACE], use the right- and left-arrow keys to investigate points at different θ values. Get trace crazy and press
to move five plotted points at a time! Try it! It’s fun!
Enter a specific è value.
After pressing [TRACE], entering a number opens up an entry line in the border at the bottom of your graph screen, as shown in the second screen.
If your calculator is in Radian mode, enter the angle, θ, in radians. If your calculator is in Degree mode, enter the angle, θ, in degrees.
Press [ENTER].
See the result as shown in the third screen.
Viewing the table of a polar graph
It is easy to view the values of your variables all in one table. Press [2nd][GRAPH] to view the table as shown in the first screen.
Read the Context Help in the border at the top of the table. To change the table increment, press [+] and edit the value at the bottom of the screen as shown in the second screen.
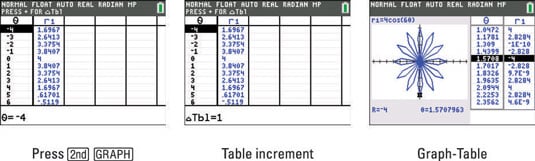
Another option is to show a split screen with a graph and a table. Press [MODE], use the arrow keys to highlight GRAPH-TABLE, and press [ENTER]. Press [GRAPH] to see the split screen. Using Trace in the Graph-Table mode automatically highlights the ordered pairs in the table, as shown in the third screen.
When using Trace, if Format is set to Rect GC, you will see X, Y, displayed on the graph screen. This means you can view X, Y, r, and θ all on the same screen! Wow!