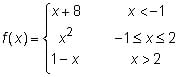
A piecewise function is actually made up of “pieces” of different functions. Each function “piece” is defined over a certain interval. Using your TI-84 Plus calculator to graph piecewise functions can be a bit tricky, but you’ll get the hang of it soon enough.
Your calculator evaluates statements and produces one of two possible truth values: 1 = True and 0 = False. When is the statement x < –2 true?
Your calculator returns a 1 (for True) when x is smaller than –2, and returns a 0 (for False) when x is equal to or larger than –2. If you divide a function by the statement x < –2, the function is divided by 1 when the statement is true, and the function is divided by 0 when the statement is false.
Guess what? You can’t divide by 0, so the function will not graph on the interval where the statement is false!
In order to graph the piecewise function here, start by graphing each piece as a separate function on the calculator. Then graph all three pieces in one function so you can show off to your friends.
Here are the steps to graph a piecewise function in your calculator:
Press [ALPHA][Y=][ENTER] to insert the n/d fraction template in the Y= editor.
Enter the function piece in the numerator and enter the corresponding interval in the denominator.
To enter the first function piece in Y1, enter (X + 8) in the numerator and (X < –1) in the denominator.
Press [2nd][MATH] to insert an inequality from the Test menu. Press
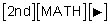
to insert “and” from the Logic menu.
Your calculator can’t evaluate a sandwiched inequality like this one: (–1 < X < 2). Fortunately, (–1 < X < 2) can also be written as a compound inequality:
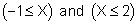
See the first screen.
Press [GRAPH] to graph the function pieces.
See the second screen.
If you can successfully graph piecewise functions in your calculator, you’re well on your way to becoming addicted to your calculator. If you know two different methods to graph piecewise functions in your calculator, then you may need to enter a 12-step program for calculator addiction! The first step is admitting you have a problem.
Here’s a method of graphing piecewise functions all in one function:
In the Y= editor, enter the first function piece using parentheses and multiply by the corresponding interval (also in parentheses).
Don’t press [ENTER] yet!
Press [+] after each piece and repeat until finished.
Refer to the third screen. In order for you to see the whole equation, the calculator was temporarily switched to Classic mode.
There are a few advantages to graphing piecewise functions all in one function. Obviously, only one function in the Y= editor is used. Another advantage is when using Trace, you don’t have to jump from function to function. One disadvantage shows up if a piecewise function has a domain other than all Real numbers. When multiplication is used, a horizontal line at y = 0 graphs for any missing domain intervals.
If one or more of the functions in your piecewise-defined function is a trigonometric function, make sure the calculator is in Radian and not Degree mode. Otherwise, your piecewise-defined function may look like a step function instead of the graph you were expecting.