With the TVM Solver, you can graph an amortization table on your TI-84 Plus calculator. An amortization schedule shows the amount of interest and principal for each periodic payment made over the life of a loan. An amortization schedule doesn’t usually fit on one page. Wouldn’t it be great to see a visual snapshot of a loan amortization showing the remaining balance for each period of the loan?
The easiest way to graph an amortization table is by using a parametric graph. To graph an amortization of the following problem, press [MODE] and change the mode to PARAMETRIC.
The average home price in Memphis, Tennessee, is $154,985. If the interest rate on a 30-year loan in 4.73%, what will the monthly payment be?
Press [Y=] and enter X1T=T. In Parametric mode, press
to enter T. Enter Y1T=bal(T).
To insert the balance command, press [APPS][ENTER][9] to insert the bal( command. See the first screen in the figure.
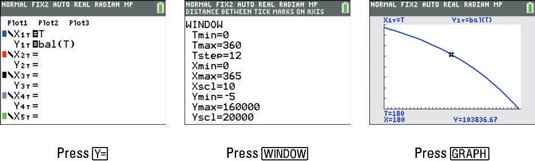
Press [WINDOW] and configure the window variables as shown in the second screen in the figure. Press [GRAPH] to view the graph of the amortization.
The x-value of the graph is the payment number and the y-value of the graph is the remaining balance. Press [TRACE] to take a closer look at your graph as shown in the third screen in the figure.