You can use the TI-84 Plus calculator to graph a recursive sequence and to graph the much more difficult Fibonacci sequence, one of the most famous sequences in mathematics.
Graphing a recursive sequence
In order to contrast explicit and recursive sequences, in this example, use the same arithmetic sequence: 2, 5, 8, . . .
Recursive formula for an arithmetic sequence: an = an–1+d
The recursive formula for this sequence is an = an–1+3, where a1=2. In this formula, an–1 represents the previous term. In Sequence mode on the calculator, the previous term is u(n–1). Follow these steps to enter a recursive sequence in your calculator:
Press [Y=] to access the Y= editor.
Enter a value for nMin.
nMin is the value where n starts counting.
Press [TRACE] to enter the variables, u, v, and w, as shown in the first screen.
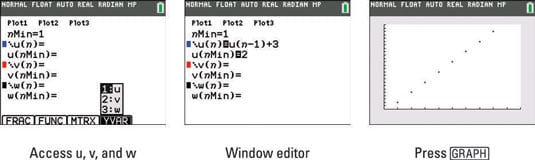
Enter the recursive formula for u(n).
Don’t forget to press

for n.
Enter u(nMin).
Enter the initial term as shown in the second screen.
Press [GRAPH.
The graph of this sequence looks exactly like the graph of the explicit function as shown in the third screen.
Graphing the Fibonacci sequence
Want to try something more difficult? The Fibonacci sequence is one of the most famous sequences in mathematics: 1, 1, 2, 3, 5, 8, . . .
The recursive formula for the Fibonacci sequence is: an = an–1+ an–2. Remember, u(n–2) means the term before the previous term in calculator lingo.
Press [Y=] to access the Y= editor.
Enter a value for nMin.
nMin is the value where n starts counting.
Press [2nd][TRACE] to enter the variables u, v, and w.
Enter the recursive formula for u(n).
Enter u(nMin).
Enter the first two terms in the sequence as a list! Press [2nd][(] to use brackets for your list. See the first screen.
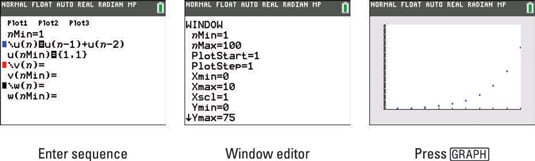
Press [WINDOW] and adjust the variables.
The value of Ymax was changed. See the second screen.
Press [GRAPH].
See the third screen.
Did you notice all the tick marks on the y-axis in the third screen? It would have been a good idea to change the Yscl to 5 or 10. Press [WINDOW] to access the Yscl variable.