Before you begin doing econometric analysis, make sure you’re familiar with your data and how to view it in the popular STATA software. After all, you don’t want to estimate an econometric model with data that’s mostly incomplete or full of errors.
In version 12.1 of STATA, the default setting allows you to open a dataset as large as 64 megabytes (MB) and containing up to 5,000 variables. If your dataset is larger than 64MB, you need to increase the memory allocated to STATA by typing “set memory #m” on the command line, where # is the size of your dataset in MB.
Similarly, if your dataset contains more than 5,000 variables, you need to type “set maxvar #” on the command line, with # being the number of variables in your dataset.
The Data tab in the menu bar contains most of the elements you need in order to get acquainted with your data. After opening a STATA dataset, you’ll regularly use the following commands:
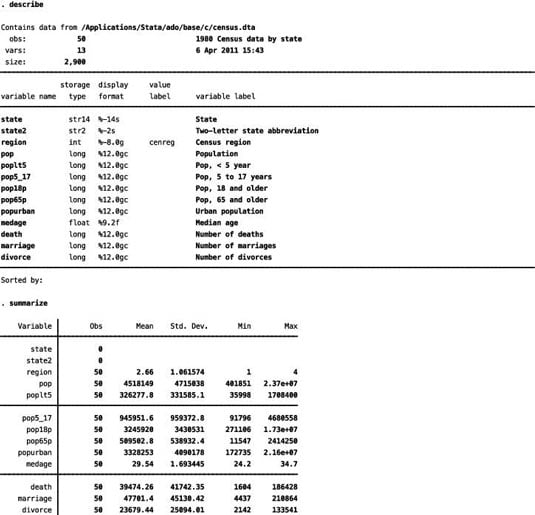
Select Data→Describe data→Describe data in memory or type “describe” on the command line and hit return: STATA shows you how many observations and variables are contained in the dataset. In addition, it lists the names and types (numeric or string) of all the variables.
Select Data→Describe data→Summary statistics or type “summarize” on the command line and hit return: With this command, STATA provides you with basic descriptive measures for all the numeric variables in your dataset. Specifically, you get the number of observations with nonmissing values, mean, standard deviation, minimum value, and maximum value for each variable.
The string variables contain letters, names, or phrases, so no mean or standard deviation can be calculated for them.
In the figure, “describe” and “summarize” commands are used to view the fundamental characteristics of the dataset.
The Data tab or “describe” and “summarize” commands provide the basic information you use for your econometric analysis. Examine the tables containing the descriptive information and make sure that all the values are sensible. In other words, make sure that the minimum, maximum, and mean values are feasible for each variable in your dataset.
You can also use the “list” command on occasion, but be careful with it because it displays the value for every variable and every observation. In other words, it displays the entire dataset. With a large dataset (thousands of observations and dozens of variables), this list isn’t likely to help you find errors unless you refine the list to a specific observation using an “if” statement or by subscripting.
Keep in mind that the results section of STATA, by default, displays approximately one page of output. STATA then prompts you with the “-more-” message. Hitting the return key allows you to see an additional line of output, and hitting the spacebar shows another page of output. If you don’t want STATA to pause for “-more-” messages, type “set more off” on the command line. Subsequent output is then displayed in its entirety.