
In managerial economics, externalities refer to beneficial or harmful effects realized by individuals or third parties who aren’t directly involved in the market exchange. Thus, an externality is a cost (in the case of a negative externality) or benefit (in the case of a positive externality) that is not reflected in the good’s price.
Negative externalities: The pollution example
Negative externalities result in social costs that are higher than the actual costs the firm pays. As a consequence, firms produce a larger quantity of output than is socially optimal. Government regulation attempts to internalize those costs for the firm, resulting in production decisions that represent true resource costs.
Commodity supply describes the relationship between the good’s quantity supplied, and the price producers are willing to accept for that good. Therefore, because some costs are not paid by the producers when there are negative externalities, they are willing to accept a price that’s lower than would be necessary if all costs were included.
An example of a negative externality is pollution. A fisherman who doesn’t consume a firm’s product experiences a negative externality if the firm’s pollution adversely affects fishing. The fisherman incurs a cost, although he’s not a consumer of that firm’s product.
The illustration shows a perfectly competitive market. If there are no externalities, the equilibrium output level, QE, corresponding to the intersection of the demand and market supply curves, represents the socially optimal output level.
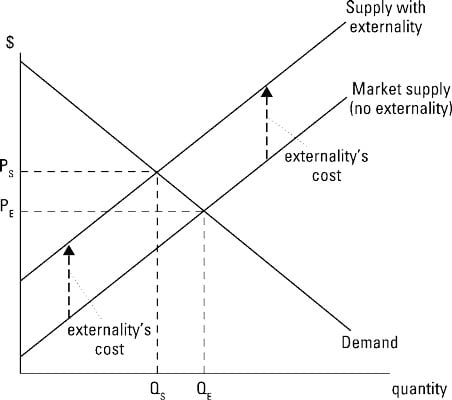
However, when pollution or another negative externality is present, the market supply curve doesn’t represent the good’s true production cost. The true cost is now represented by the supply curve that includes the externality.
In this situation, the good’s social cost equals the firms’ marginal cost curves represented by the market supply plus the marginal cost of the negative externality. As a consequence, marginal social cost results in the true supply curve with the externality being higher than the market supply.
Assuming the demand curve remains the same, the market’s socially optimal output level is QS corresponding to the intersection of demand and the supply curve with externality. The corresponding price consumers pay to cover the full cost of production is PS.
The purpose of government regulation is to reduce the market output from QE to the socially optimal level, QS. In order to accomplish this goal, government must internalize the cost of the negative externality for the firm. This is accomplished through various methods, such as fines, regulations requiring different production techniques, or taxes.
Positive externalities: The honey example
While negative externalities result in social costs that are greater than the actual costs paid by the firm, positive externalities exist when individuals receive uncompensated benefits through somebody else’s consumption of the good. Positive externalities result in firms producing a smaller quantity of output than is socially optimal. Government regulation attempts to compensate firms for those benefits, resulting in production decisions that recognize the good’s true value to society.
Commodity demand describes the relationship between the good’s quantity demanded and the price consumers are willing and able to pay for the good. Therefore, price represents the value of an additional unit of the good to consumers. However, if other individuals receive benefits — even though they aren’t part of the market transaction — those benefits aren’t included in the demand curve the firm faces.
Honey is an example of a good with positive externalities. The market demand for honey is based upon the price individuals are willing to pay to consume the product. However, the bees that produce honey also pollinate flowers and other plants. The beekeeper doesn’t receive any compensation for this benefit.
If the beekeeper did receive compensation, the beekeeper may be inclined to have more bees, leading to greater plant pollination, as well as more honey.
The illustration below shows a perfectly competitive market with a positive externality. If there are no externalities, the equilibrium output level, QE, and price, PE, corresponding to the intersection of the market demand curve and supply curve represents the socially optimal output level.
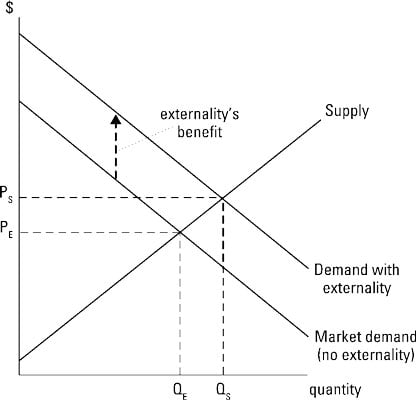
The presence of a positive externality, however, means the market demand curve doesn’t represent the good’s true value to society. With a positive externality, the true demand is higher than the market demand. This higher demand incorporates the added benefit or value of the positive externality.
The resulting socially optimal output level corresponds to the intersection of the new demand curve with the positive externality and the market supply curve resulting in the socially optimal quantity QS and price PS.
Government intervention seeks to increase the market output to the socially optimal level. In order to accomplish this task, government may subsidize the producer to reflect the positive externality.
In the case of honey, government may place a tax on plants and seeds and use the tax revenue to pay beekeepers a subsidy based on how many beehives they have. With the subsidy, beekeepers have an incentive to have more hives and bees.