The tools Windows offers to monitor performance and resources are:
- The Performance Monitor
- The Performance tab in the Task Manager window
- The Resource Monitor
- Of all the tools, the Performance Monitor is the oldest, introduced for Windows NT back in the 1990s. It's also the most complex of the trio.
- The Resource Monitor was introduced with Windows Vista. It's the most useful of the tools, especially for tracking down issues with specific programs.
- The Task Manager's Performance tab once dwelled in the System Configuration Utility (MSCONFIG) window. It's a bit friendlier than the Performance Monitor—plus, it's easier to access.
- Yes, overlap exists between all three tools. You don't have to use them all.
- Performance and resources play a role in troubleshooting with regard to software. For example, a bug may cause a program to consume more and more resources over time. Known as a memory leak, it's easy to spot such a program based on how it's using resources and how the PC's performance degrades over time.
The Performance Monitor
The Performance Monitor console is the most sophisticated of the Windows resource graphing tools. It’s also the most difficult to use, probably due to its origin as a Windows NT program.To bring up the Performance Monitor console window, use these steps:
- Tap the Windows key on the keyboard.
- Type performance.
- Choose the Performance Monitor app from the list of search results. The Performance Monitor appears in a console window.
- From the left side of the console window, choose Performance Monitor. This item is located in the Monitoring Tools folder, as illustrated here.
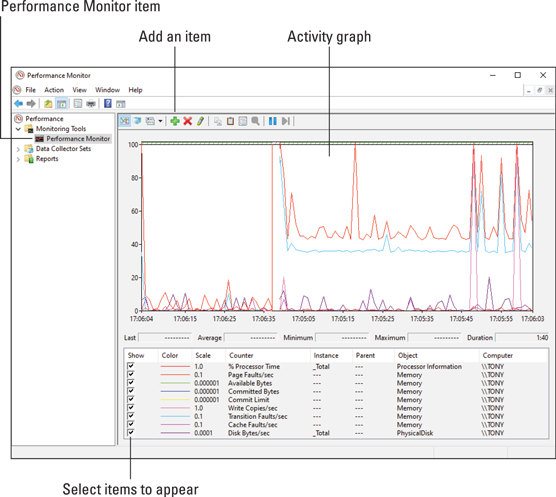 The Performance Monitor.
The Performance Monitor window is rather barren at first; you need to add items to the monitor to view the graph, especially one as detailed as the one shown.
To add an item, click the Add (green plus) button. In the Add Counters dialog box, click to select a counter and then click the Add>> button. Click OK to view the results.
The display in the Performance Monitor can get rather hectic, which makes it my least favorite monitoring tool. Still, it offers plenty of details. If you need to get specific in monitoring an activity, this is the tool to use.
For example, to monitor network traffic, add the Network Adapter counter to the display. Choose a specific counter to monitor by unchecking the other counters. For example, uncheck everything but Bytes Received to check on incoming network traffic.
- To clean up the display, select a counter and click the X (Cancel) button. You can Shift+click to select multiple counters and remove them all at once.
- The difference between removing a counter and unchecking it is that you can more easily recheck a counter to again review its status.
The Performance tab
The easiest monitoring tool to use is found in the Task Manager window. To view this item, follow these steps:- Press Ctrl+Esc to bring up the Task Manager window.
- Click the Performance tab. The Performance tab is illustrated here.
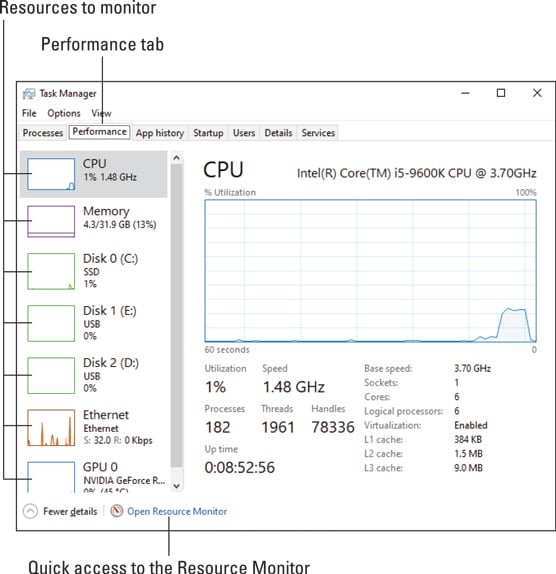 The Task Manager’s Performance tab.
The Performance tab lists key resources as thumbnails on the left side of the window. In the preceding figure, you see entries for the CPU, memory, mass storage devices, the network, and the graphics processing unit (GPU) with more items in a scrolling list.
To view a different category’s performance graph, choose its thumbnail from the left side of the window. The graph changes over time, scrolling from right to left. The higher the line on the graph, the more the chosen resource is in use or being consumed.
The CPU meter tells you how much processing horsepower is in use. In the preceding figure, the values are low until a spike happens. The low values indicate that Windows isn’t doing much; the spike occurred when I opened another program. If the figure were high, or suddenly spiked, that means more activity is taking place, such as a background task or service.
The Memory meter tracks how much memory is in use. This item fluctuates as you use programs. For example, running a photo editor may consume a huge amount of memory, but the Performance tab would show that amount of memory freed after you exit the program.
Disk items show storage activity. Ethernet shows network activity. If a Bluetooth adapter is available, you may see an entry for it as well.
For further details, use the Resource Monitor. As a shortcut, click the Open Resource Monitor link, located at the bottom of the Task Manager window’s Performance tab.
System resources
To monitor specific programs or activities, the best tool to use is the Resource Monitor. It’s far less complicated than Performance Monitor, and it offers more information and control than the Performance tab in Task Manager.To open the Resource Monitor, follow these directions:
- Tap the Windows key.
- Type resource.
- Choose the Resource Monitor app from the search results. The Resource Monitor window appears, illustrated here.
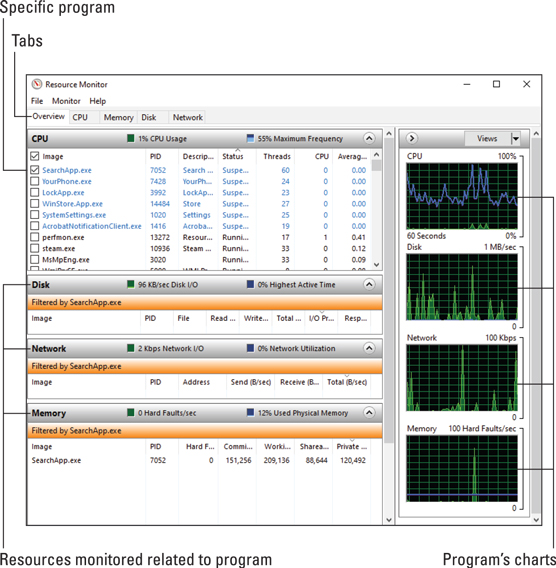 The Resource Monitor.
The Resource Monitor’s Overview tab, shown, shows the big picture on system resources: CPU (processor), Memory, Disk, and Network, along with charts for each.
The various tabs show more details and even more charts.
What’s interesting about the Resource Monitor is that you can examine the effects of specific programs on resources. For example, in the preceding figure, the service SearchApp.exe is selected. Its effect on resources is shown in each category (click the chevron to expand a category) as well as highlighted in each of the graphs. When you choose a program in this manner, you can spy on its effects on all resources.
Use the monitors as troubleshooting tools
All the performance‐ and resource‐monitoring tools provide good feedback, but the details are trivial. Activity always abounds inside a computer. The concern is whether that activity is causing the system to slow down.Whenever the PC starts acting slowly, pop up Task Manager and click the Processes tab. Click the CPU column header to sort the list of running programs by processor use. (If necessary, click the header twice so that the programs using the CPU the most appear at the top of the list.) The program using the most CPU time is probably the one slowing your PC.
You can also click Task Manager’s Performance tab to check on memory and other resources. But to confirm that the single program is consuming too many resources, use Resource Manager: in the Resource Manager window, choose the suspect program from the list on the Overview tab. Then select all resources.
What you’re looking for is increased consumption of resources over time. In some cases, the program may busy itself for a short span, and then regular activity resumes. When a program continues to consume resources, you might consider terminating it to see whether the PC’s performance improves.
- If a single program is to blame, consider getting an update for the program.
- If the program is a background task that gobbles too many resources, consider rescheduling the task for a time when you’re not using the computer.
- A program that continues to use resources after it quits, especially memory, has a memory leak. You should stop using the program and see whether an update or a replacement is available.
- Some web page plug-ins may cause problems. These plug-ins might appear as issues with the web browser program itself, but they’re not. The way to fix this issue is to check the web browser’s settings or preferences and disable the plug-in.
- Malware also consumes resources at a rabid pace. You can attempt to halt the run‐amok program, but it’s best to run a scan and have Windows Defender remove it.