
- Central processing unit (CPU) usage
- Physical memory usage
- Virtual memory (swap-space) usage
- Hard drive usage
Using the top utility in Linux
To view thetop CPU processes — the ones that use most of the CPU time — you can use the text mode top utility. To start that utility, type top in a terminal window (or text console). The top utility displays a text screen listing the current processes, arranged in the order of CPU usage, along with various other information, such as memory and swap-space usage.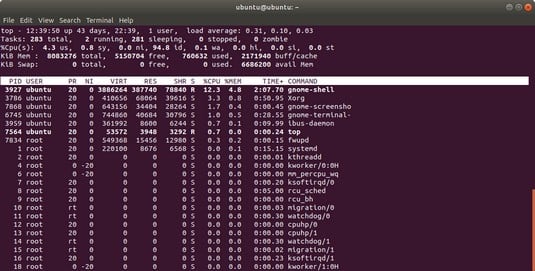 You can see the top CPU processes by using the top utility.
The top utility updates the display every 5 seconds. If you keep top running in a window, you can continually monitor the status of your Linux system. To quit top, press Q, press Ctrl+C, or close the terminal window.
- The first line shows the current time, how long the system has been up, how many users are logged in, and three load averages — the average number of processes ready to run during the past 1, 5, and 15 minutes.
- The second line lists the total number of processes/tasks and the status of these processes.
- The third line shows CPU usage — what percentage of CPU time is used by user processes, what percentage by system (kernel) processes, and the percentage of time during which the CPU is idle.
- The fourth line shows how the physical memory is being used — the total amount, how much is used, how much is free, and how much is allocated to buffers (for reading from the hard drive, for example).
- The fifth line shows how the virtual memory (or swap space) is being used — the total amount of swap space, how much is used, how much is free, and how much is being cached.
top displays.
| Heading | Meaning |
| PID | Process ID of the process. |
| USER | Username under which the process is running. |
| PR | Priority of the process. |
| NI | Nice value of the process. The value ranges from –20 (highest priority) to 19 (lowest priority), and the default is 0. (The nice value represents the relative priority of the process: The higher the value, the lower the priority and the nicer the process, because it yields to other processes.) |
| VIRT | Total amount of virtual memory used by the process, in kilobytes. |
| RES | Total physical memory used by a task (typically shown in kilobytes, but an m suffix indicates megabytes). |
| SHR | Amount of shared memory used by the process. |
| S | State of the process (S for sleeping, D for uninterruptible sleep, R for running, Z for zombies — processes that should be dead but are still running — and T for stopped). |
| %CPU | Percentage of CPU time used since the last screen update. |
| %MEM | Percentage of physical memory used by the process. |
| TIME+ | Total CPU time the process has used since it started. |
| COMMAND | Shortened form of the command that started the process. |
Using the uptime command in Linux
You can use theuptime command to get a summary of the system’s state. Just type the command like this:
uptimeIt displays output similar to the following:
15:03:21 up 32 days, 57 min, 3 users, load average: 0.13, 0.23, 0.27This output shows the current time, how long the system has been up, the number of users, and (finally) the three load averages — the average number of processes that were ready to run in the past 1, 5, and 15 minutes. Load averages greater than 1 imply that many processes are competing for CPU time simultaneously.
The load averages give you an indication of how busy the system is.
Using the vmstat utility in Linux
You can get summary information about the overall system usage with thevmstat utility. To view system usage information averaged over 5-second intervals, type the following command (the second argument indicates the total number of lines of output vmstat displays):
vmstat 5 8You see output similar to the following listing:
procs -----------memory---------- ---swap-- -----io---- --system-- ----cpu----
r b swpd free buff cache si so bi bo in cs us sy id wa
0 0 31324 4016 18568 136004 1 1 17 16 8 110 33 4 61 1
0 1 31324 2520 15348 139692 0 0 7798 199 1157 377 8 8 6 78
1 0 31324 1584 12936 141480 0 19 5784 105 1099 437 12 5 0 82
2 0 31324 1928 13004 137136 7 0 1586 138 1104 561 43 6 0 51
3 1 31324 1484 13148 132064 0 0 1260 51 1080 427 50 5 0 46
0 0 31324 1804 13240 127976 0 0 1126 46 1082 782 19 5 47 30
0 0 31324 1900 13240 127976 0 0 0 0 1010 211 3 1 96 0
0 0 31324 1916 13248 127976 0 0 0 10 1015 224 3 2 95 0
The first line of output shows the averages since the last reboot. After that line,
vmstat displays the 5-second average data seven more times, covering the next 35 seconds. The tabular output is grouped as six categories of information, indicated by the fields in the first line of output. The second line shows further details for each of the six major fields. You can interpret these fields by using the table below.
| Field Name | Description |
| procs | Number of processes and their types: r = processes waiting to run, b = processes in uninterruptible sleep, and w = processes swapped out but ready to run. |
| memory | Information about physical memory and swap-space usage (all numbers in kilobytes): swpd = virtual memory used, free = free physical memory, buff = memory used as buffers, and cache = virtual memory that’s cached. |
| swap | Amount of swapping (the numbers are in kilobytes per second): si = amount of memory swapped in from disk, and so = amount of memory swapped to disk. |
| io | Information about input and output. (The numbers are in blocks per second, where the block size depends on the disk device.) bi = rate of blocks sent to disk, and bo = rate of blocks received from disk. |
| system | Information about the system: in = number of interrupts per second (including clock interrupts), and cs = number of context switches per second — how many times the kernel changed which process was running. |
| cpu | Percentages of CPU time used: us = percentage of CPU time used by user processes, sy = percentage of CPU time used by system processes, id = percentage of time CPU is idle, and wa = time spent waiting for input or output (I/O). |
vmstat utility’s output, high values in the si and so fields indicate too much swapping. (Swapping refers to the copying of information between physical memory and the virtual memory on the hard drive.) High numbers in the bi and bo fields indicate too much disk activity.
Checking disk performance and disk usage in Linux systems
Linux comes with the/sbin/hdparm program to control IDE or ATAPI hard drives, which are common on PCs. One feature of the hdparm program allows you to use the -t option to determine the rate at which data is read from the disk into a buffer in memory. Here’s the result of typing /sbin/hdparm -t /dev/hda on one system:
/dev/hda:
Timing buffered disk reads: 178 MB in 3.03 seconds = 58.81 MB/sec
The command requires the IDE drive’s device name (
/dev/hda for the first hard drive and /dev/hdb for the second hard drive) as an argument. If you have an IDE hard drive, you can try this command to see how fast data is read from your system’s disk drive.To display the space available in the currently mounted file systems, use the df command. If you want a more readable output from df, type the following command:
df -hHere’s typical output from this command:
Filesystem Size Used Avail Use% Mounted on
/dev/hda5 7.1G 3.9G 2.9G 59% /
/dev/hda3 99M 18M 77M 19% /boot
none 125M 0 125M 0% /dev/shm
/dev/scd0 2.6G 0 100% /media/cdrecorder
As this example shows, the
-h option causes the df command to display the sizes in gigabytes (G) and megabytes (M).To check the disk space being used by a specific directory, use the du command. You can specify the -h option to view the output in kilobytes (K) and megabytes (M), as shown in the following example:
du -h /var/logHere’s typical output from that command:
152K /var/log/cups
4.0K /var/log/vbox
4.0K /var/log/httpd
508K /var/log/gdm
4.0K /var/log/samba
8.0K /var/log/mail
4.0K /var/log/news/OLD
8.0K /var/log/news
4.0K /var/log/squid
2.2M /var/log
The
du command displays the disk space used by each directory, and the last line shows the total disk space used by that directory. If you want to see only the total space used by a directory, use the -s option. Type du -sh /home to see the space used by the /home directory, for example. The command produces output that looks like this:
89M /home