Data mining is just what its name implies — it’s the labor of digging and sorting through Six Sigma data for clues to where the improvement gems may lie. Sometimes you have to go through a lot of dirt to find the gems. Searching for clues in data is not much different.
Observational studies
Where do you begin your search for improvement gems? And what are the tools of the trade? Six Sigma practitioners have refined the data mining process to an efficient, powerful set of tools.
Data, data everywhere
A world of potential data exists all around you. Consider things such as
The number of reams of paper your company uses in its copy center varies from day to day.
Each classroom contains a different number of students.
Different people work on a single process step, depending on their daily assignment.
The feed rate of a milling machine is adjusted depending on the task.
One way to immediately tap into this cache of information is to simply begin to observe all the potential input and output variables in your improvement project and record them.
| Obs. No. | Dept. (X1) | Hour (X2) | System (X3) | Processor (X4) | Items/Hour (Y) |
|---|---|---|---|---|---|
| 1 | B | 8 | web | Sally | 43 |
| 2 | A | 5 | web | Sally | 37 |
| 3 | B | 4 | web | Bob | 44 |
| 4 | B | 8 | Desktop | Sally | 35 |
| 5 | B | 4 | web | Sally | 42 |
| 6 | A | 5 | web | Sally | 39 |
| 7 | B | 3 | Mainframe | Sally | 41 |
| 8 | A | 8 | Mainframe | Joan | 36 |
| 9 | A | 1 | web | Sally | 39 |
| 10 | B | 4 | Mainframe | Joan | 40 |
Observational studies
Thinking about, pondering over, and probing your recorded observations is a proven path to increased understanding. In Six Sigma, these activities are called observational studies. Observational studies revolve around analyzing the variation in the observed critical output or outputs and investigating which input variables that variation is linked to. What you’re looking for are potential sources of the variation.
Potential sources of variation through graphical analysis
To study whether an observed input has an effect on an observed output, you create a set of box and whisker plots of the critical output, with each box and whisker plot corresponding to a different condition of the input variable. Several computer programs — including Minitab, JPM, and Microsoft Excel — automatically create these plots (see Part V).
An example
For example, you see a partial list of the data collected for a transactional process. The key output (Y) is how many items per hour are produced. The big net of possible input variables includes the department performing the transaction (X1), the hour of the day in which the transaction was processed (X2), the processing system used (X3), and the actual person performing the transaction (X4).
What effect does the processor (X4) have on the items per hour output (Y)?
Does Bob, Joan, or Sally have much influence on the items transacted per hour? From the graphical view, you can clearly see that the number of items transacted per hour is about the same for each operator; they have about the same average level and about the same amount of variation. This result tells you that the processor variable (X4) isn’t a key contributor to the output variation.
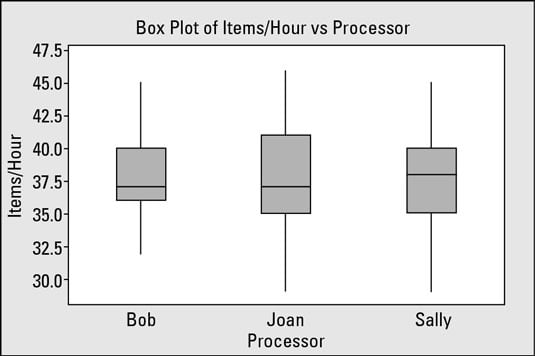
Statisticians using advanced techniques numerically compute the variation between the centers of variation for each of the different X4 conditions and call this value the between group variation. They then perform a similar calculation to quantify the average width of variation for each individual condition and call that value the within group variation.
If the between group variation is large compared to the within group variation, they conclude that the investigated variable does indeed influence the output. The box and whisker method is just a simple, intuitive way to accomplish the same thing while bypassing all math and technicalities.
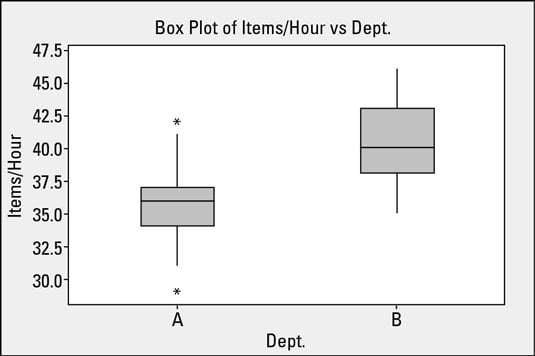
What about the department performing the transaction (X3)? Does it contribute to the output?
Graphically, you can quickly see that the difference between the centers of variation from department A and department B is significant compared to the average width of variation within the departments. This variation tells you that the department performing the transaction does have some influence on the output. This variable will pass through your funnel and be investigated further for conclusive evidence.
Another way to perform observational studies is through correlation calculations. These calculations give you the same insight but aren’t graphical, so they’re harder to use and interpret.
Additional studies
Many other tools are at your disposal when performing observational studies, including the following:
Multi-variable studies: Multi-vari studies, as the name is often shortened, allow you to investigate the effect of several input variables at a time on a critical output.
Main effects plots: Main effects plots are a basic graphical technique. They’re an extremely easy and powerful way to explore the principle effect of a variable and its different levels on a critical output.
Interaction effects plots: Sometimes, one variable by itself doesn’t have a major impact on an output. But when you combine it with other variables, the combination has a significant influence called an interaction effect. For example, adding eggs by themselves to a cake batter doesn’t immediately impact the cake’s texture. But adding eggs to the batter and heating it in an oven produces a yummy dessert.
Each of these additional observational studies is available in most off-the-shelf Six Sigma software packages (see Part V). This accessibility makes performing these analyses automatically much easier, giving you a big advantage over your predecessors.