T.DIST, with the FALSE option in the Cumulative box.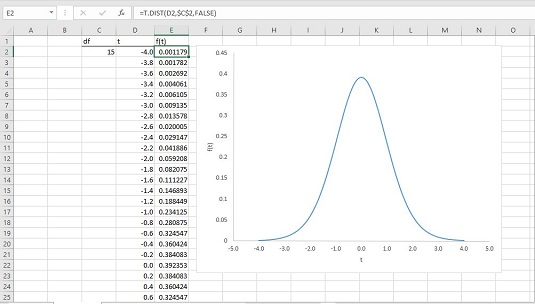
Here are the steps:
- Put the degrees of freedom in a cell. For this example, put 15 into cell C2.
- Create a column of values for the statistic. In cells D2 through D42, put in the values –4 to 4 in increments of .2.
- In the first cell of the adjoining column, put the value of the probability density for the first value of the statistic.
Because you’re graphing a t-distribution, you use
T.DISTin cell E2. For the value of X, you click cell D2. For df, you click C2 and press the F4 key to anchor this selection. In the Cumulative box, typeFALSEto return the height of the distribution for this value of t. Then click OK. - Autofill the column with the values.
- Create the chart. Highlight both columns. On the Insert tab, in the Charts area, select Scatter with Smooth Lines.
- Modify the chart. The chart appears with the y-axis down the middle. Click on the x-axis to open the Format Axis panel. Under Axis Options, in the Vertical Axis Crosses area, click the radio button next to Axis Value and type -5 into the box. You can then click inside the chart to make the Chart Elements tool (the plus sign) appear and use it to add the axis titles (t and f(t)). You can also delete the chart title and the gridlines if you like to stretch out the chart.
- Manipulate the chart. To help you get a feel for the distribution, try different values for df and see how the changes affect the chart.