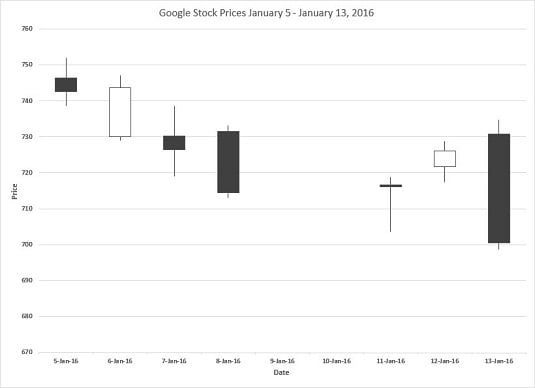
Each data point in the Stock chart is a box with a line extending upward and a line extending downward. The upper and lower bounds of the box represent the opening and closing prices for a particular date — note that this does not say respectively. That’s because sometimes the opening price is higher than the closing price, and sometimes vice versa.
How do you know which is which? If the box is empty, the opening price is the lower bound (and the stock posted a gain for the day). If the box is filled, the opening price is the upper bound (and the stock posted a loss).
The endpoint of the upward-extending line is the high price for the day, and the endpoint of the downward-extending line is the low price for the day.
Notice that Excel fills in the x-axis with empty dates (days when the stock market was closed.)
To create the chart, follow these steps:
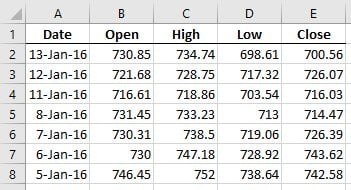
- Enter your data into a worksheet.
Check out the data in the worksheet.
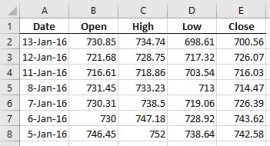
- Select the data that go into the chart. For this example, that’s cells A1 through E8.
- Click Insert | Recommended Charts, and select the chart type.
Curiously, Excel does not recommend the Stock chart. So, you select the All Charts tab, pick Stock in the left column, and choose Open-High-Low-Close from the options. Here is the result.
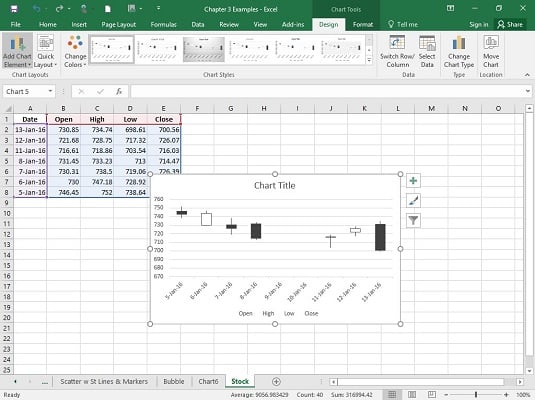
- Modify the chart.
Click the generic chart title and type a new title. Next, click the Chart Elements tool (labeled with a plus sign) and used it to add generic axis titles to the chart. Then, type new titles to replace the generic ones. Finally, select each axis title and pressed Ctrl+B to turn the font bold. You can do that for the chart title, too.