The new forecasting capability uses Excel’s new (Windows only) FORECAST
FORECAST.ETScreates a forecast based on triple exponential smoothing. (See the earlier sidebar “Tripling the fun — exponentially.”)FORECAST.ETS.CONFINTreturns a confidence interval for a forecast value.FORECAST.ETS.STATreturns values of statistics associated with the ETS forecast.FORECAST.ETS.SEASONALITYdetermines the length of the seasonal pattern within the data.
Here are the steps:
- Enter the data, with dates in one column. The data are in Columns A and B.
- Select the data.
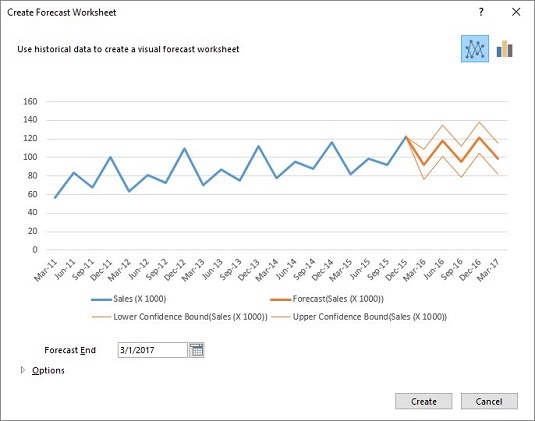
- On the Data tab, in the Forecast area, select Forecast Sheet.
This opens the Create Forecast Worksheet dialog box. As you can see, Excel is already hard at work figuring things out for you. The blue line is the data, the bold orange line is the forecasts, and the lighter orange lines are the 95% confidence limits for the forecasts.
- In the Create Forecast Worksheet dialog box, click the Options arrow in the bottom left corner. This expands the dialog box.
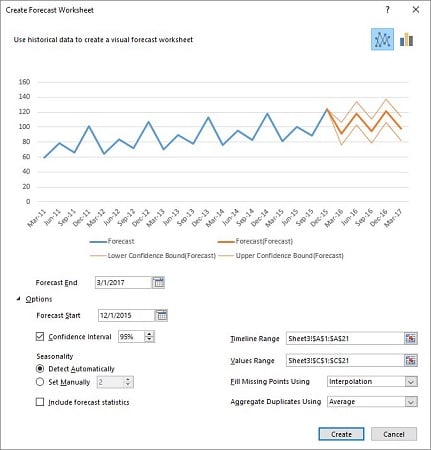
- Make necessary modifications in the expanded dialog box.
To get an idea about forecast accuracy, move the date in the Forecast Start box back to March 31, 2015. This way, you can match some of the forecasts with data.
The Seasonality area shows 2 in the grayed-out box next to Set Manually. This means that
FORECAST.ETS.SEASONALITYhas detected a pattern that repeats every two quarters. The pattern repeats every four quarters, so select the Set Manually radio button and change the 2 to 4. The chart in the dialog box changes immediately to show way more accurate forecasts and narrower 95% confidence limits. Select the check box next to Include Forecast Statistics. You have the option of changing confidence intervals and some other things, but what you’ve done is sufficient. - Click Create. This opens the created Forecast Worksheet.
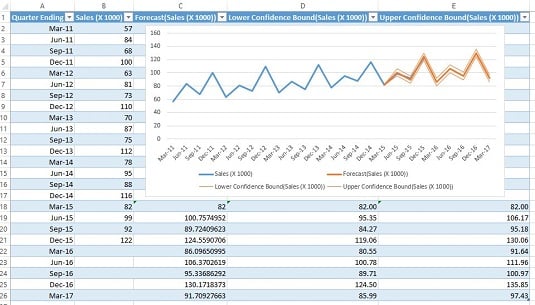
Along with the chart, the Forecast Worksheet shows the forecast values in Column C (calculated by FORECAST.ETS), and the confidence limits in Columns D and E (calculated by FORECAST.ETS.CONFINT).
The Forecast Worksheet also provides the Forecast Statistics in Columns G and H (courtesy of FORECAST.ETS.STAT).
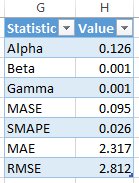
You can see the Alpha, Beta, and Gamma values. The other four are measures of how well the forecasts fit the data. The first two are a bit involved.
The third one, MAE, is the mean absolute error — the average of the absolute value of the differences between data and forecasts. The last one, RMSE, is root mean squared error, which is the average of the squared deviations of the data from the forecasts. You can think of the standard error of estimate in regression as a root mean square error adjusted for degrees of freedom.