
The Covariance tool, available through the Data Analysis add-in in Excel, quantifies the relationship between two sets of values. The Covariance tool calculates the average of the product of deviations of values from the data set means.
To use this tool, follow these steps:
Click the Data Analysis command button on the Data tab.
The Data Analysis dialog box appears.
When Excel displays the Data Analysis dialog box, select the Covariance tool from the Analysis Tools list and then click OK.
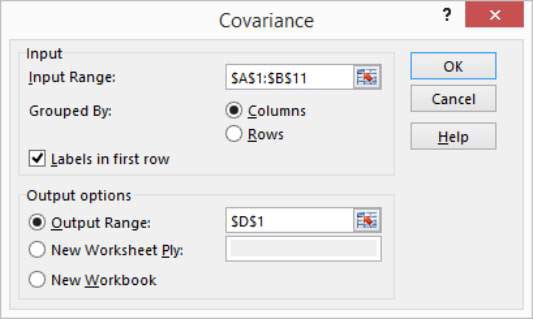
Excel displays the Covariance dialog box.
Identify the range of X and Y values that you want to analyze.
To look at the correlation between ads and sales data, enter the worksheet range $A$1:$B$11 into the Input Range text box.
Select the Labels in First Row check box if the input range includes labels in the first row.
Verify that the Grouped By radio buttons — Columns and Rows — correctly show how you’ve organized your data.
Select an output location.
Use the Output Options radio buttons and text boxes to specify where Excel should place the results of the covariance analysis. To place the results into a range in the existing worksheet, select the Output Range radio button and then identify the range address in the Output Range text box. If you want to place the results someplace else, select one of the other Output Options radio buttons.
Click OK after you select the output options.
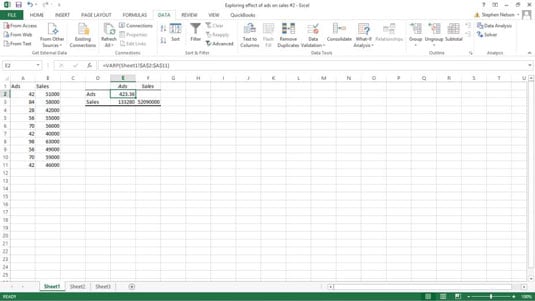
Excel calculates the covariance information for the data that you identified and places it in the specified location. Here are the covariance results for the ads and sales data.