
iris data frame. This is the iris data frame that’s in the base R installation. Fifty flowers in each of three iris species (setosa, versicolor, and virginica) make up the data set. The data frame columns are Sepal.Length, Sepal.Width, Petal.Length, Petal.Width, and Species.For this discussion, you’re concerned with only Petal.Length, Petal.Width, and Species. That way, you can visualize the data in two dimensions.
The image below plots the iris data frame with Petal.Length on the x-axis, Petal.Width on the y-axis, and Species as the color of the plotting character.
In k-means clustering, you first specify how many clusters you think the data fall into. In the image below, a reasonable assumption is 3 — the number of species. The next step is to randomly assign each data point (corresponding to a row in the data frame) to a cluster. Then find the central point of each cluster. ML honchos refer to this center as the centroid. The x-value of the centroid is the mean of the x-values of the points in the cluster, and the y-value of the centroid is the mean of the y-values of the points in the cluster.
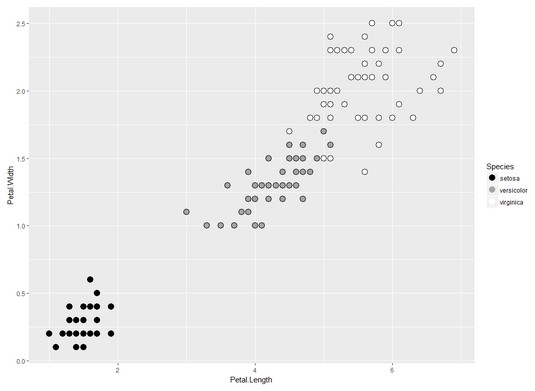 Two dimensions of the iris data frame.
The next order of business is to calculate the distance between each point and its centroid, square that distance, and add up the squared distances. This sum-of-squared-distances-within-a-cluster is better known as the within sum of squares.
Finally, and this is the crucial part, the process repeats until the within sum of squares for each cluster is as small as possible: in other words, until each data point is in the cluster with the closest centroid.
It’s also possible to calculate a centroid for the entire set of observations. Its x-coordinate is the average of every data point’s x-coordinate (Petal.Length, in this example), and its y-coordinate is the average of every data point’s y-coordinate (Petal.Width, in this example). The sum of squared distances from each point to this overall centroid is called the total sum of squares. The sum of squared distances from each cluster centroid to the overall centroid is the between sum of squares.
The ratio (between sum of squares)/(within sum of squares) is a measure of how well the k-means clusters fit the data. A higher number is better.
If these sum-of-squares ring a bell, you’ve most likely heard of a statistical analysis technique called analysis of variance. If the ratio of those two sums of squares sounds familiar, you might remember that, in another context, that ratio’s square root is called the correlation coefficient.