A dashboard is another type of visualization you can use to display a comprehensive predictive analytics model. The dashboard will allow you, using a control button, to change any step in the predictive analytics pipeline. This can include selecting the data, data preprocessing, selecting a predictive model, and selecting the right evaluation versions.
You can easily modify any part of the pipeline at anytime using the control button on the dashboard. A dashboard is an interactive type of visualization where you have control and you can change the diagrams, tables, or maps dynamically based on the inputs you choose to include in the analyses that generate those charts and graphs.
At least one predictive analytics technique is purely inspired by the natural phenomenon of birds flocking. The bird-flocking model not only identifies groupings in data, it shows them in dynamic action. The same technique can be used to picture hidden patterns in your data.
The model represents data objects as birds flying in a virtual space, following flocking rules that orchestrate how a migrating swarm of birds moves in nature.Representing several data objects as birds reveals that similar data objects will flock together to form subflocks (groupings). The similarity among objects in the real world is what drives the movements of the corresponding birds in the virtual space. For example, imagine that you want to analyze the online data collected from several Internet users (also known as netizens).
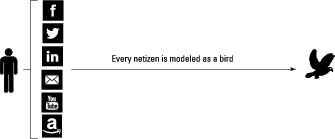
Every piece of information (gleaned from such sources as social network user information and customer online transactions) will be represented as a corresponding bird in the virtual space.
If the model finds that two or more users interact with each other through email or chat, appear in the same online photo, buy the same product, or share the same interests, the model shows those two netizens as birds that flock together, following natural flocking rules.
The interaction (that is, how close the representative birds get to each other) is expressed as a mathematical function that depends on the frequency of social interaction, or the intensity with which the users buy the same products or share the same interests. This latest mathematical function depends purely on the type of analytics you’re applying.
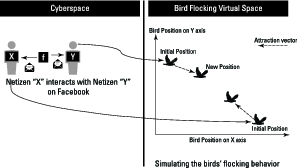
The image above depicts the interaction on Facebook between Netizens X and Y in cyberspace as bird-flocking virtual space, where both X and Y are represented as birds. Because Netizens X and Y have interacted with each other, the next flocking iteration will show their two birds as closer together.
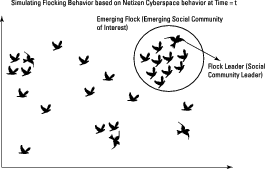
An algorithm known as “flock by leader,” invented by Prof. Anasse Bari and Prof. Bellaachia (see the following references), was inspired by a recent discovery that revealed the leadership dynamics in pigeons. This algorithm can mine user input for data points that enable it to detect leaders, discover their followers, and initiate flocking behavior in virtual space that closely mimics what happens when flocks form naturally — except the flocks, in this case, are data clusters called data flocks.
This technique not only detects patterns in data, but also provides a clear pictorial representation of the results obtained by applying predictive analytics models. The rules that orchestrate natural flocking behavior in nature were extended to create new flocking rules that conform to data analytics:
- Data flock homogeneity: Members of the flock show similarity in data.
- Data flock leadership: The model anticipates information leaders.
Representing a large dataset as a flock of birds is one way to easily visualize big data in a dashboard.
This visualization model can be used to detect pieces of data that are outliers, leaders, or followers. One political application could be to visualize community outliers, community leaders, or community followers. In the biomedical field, the model can be used to visualize outliers’ genomes and leaders among genetic samples of a particular disease (say, those that show a particular mutation most consistently).A bird-flocking visualization can also be used to predict future patterns of unknown phenomena in cyberspace — civil unrest, an emerging social movement, a future customer’s lineage.
The flocking visualization is especially useful if you’re receiving a large volume of streamed data at high velocity: You can see the formation of flocking in the virtual space that contains the birds that represent your data objects. The results of data analytics are reflected (literally) on the fly on the virtual space. Reality given a fictional, yet observable and analytically meaningful, representation purely inspired from nature. Such visualizations can also work well as simulations or what-if scenarios.
A visualization based on flocking behavior starts by indexing each netizen to a virtual bird. Initially, all the birds are idle. As data comes in, each bird starts flocking in the virtual space according to the analytics results and the flocking rules.
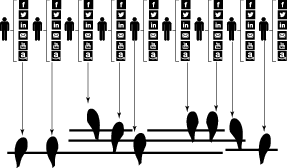
Below, the emerging flock is formed as the analytics are presented.
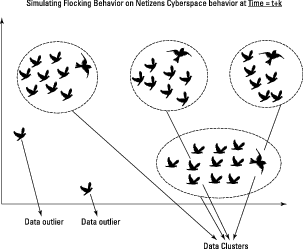
After analyzing data over a large period of time ending at t+k, the results of this application of predictive analytics results can be depicted as shown below: The flock-by-leader algorithm differentiates the members of the flock into three classes: a leader, followers, and outliers.
The flock-by-leader algorithm was invented by Dr.Bari and Dr.Bellaachia and it is explained in details in these resources:
- “Flock by Leader: A Novel Machine Learning Biologically-Inspired Clustering Algorithm”, IEEE International Conference of Swarm Intelligence, 2012.
This also appears as a book chapter in Advances in Swarm Intelligence, 2012 Edition – (Springer-Verlag).
- “SFLOSCAN: A Biologically Inspired Data Mining Framework for Community Identification in Dynamic Social Networks”, IEEE International Conference on Computational Intelligence, 2011 (SSCI 2011), 2011.