You can combine candlestick price bars with other market indicators to better understand how the security is being traded. Many traders who don’t act directly on the information contained in the candlestick patterns still use the notation on every chart because of its visual appeal and because a candlestick bar or pattern often confirms some other indicator to which they give priority.
This figure shows a set of parallel support and resistance lines called a channel. You use a channel to outline the probable limit of future prices moves, either up or down.
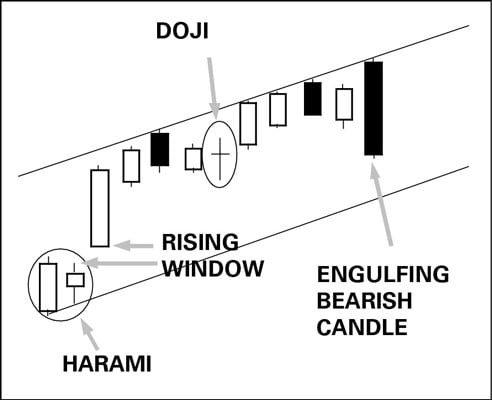
This chart includes several candlesticks:
Harami
Rising window (upward gap)
A tall, white candle
These three candlesticks together are bullish and alert you to go back and start the channel at the lowest low, the bar before the harami.
Here’s a breakdown of the formation:
The real bodies push against the top of the channel resistance line, followed by a doji, which suggests that traders are having second thoughts.
The two white candles indicate that the reconsideration of the move on the doji day culminated in traders’ decision to keep taking the price up. In this occasion, the doji wasn’t a reversal indicator, at least not for the next day.
After the two white candles comes a bearish engulfing candle, a reversal warning that this up move may be ending. The engulfing candle alerts you to watch the next day’s activity, especially the open, with an eagle eye.
You can also use candlesticks to confirm relative strength, momentum, and many other indicators. Some traders use specific candlesticks to identify set-ups, or a pattern configuration that is believed to have a high probability of delivering a specific outcome. For example:
After a long series of falling bars, you see a doji bar (indicating indecisiveness) or a harami that closes near the upper end of the previous candle — and then a bullish engulfing candlestick.
At the same time, another indicator, such as the stochastic oscillator or relative strength index, shows the security to be deeply oversold.
This scenario is a high-probability trade set-up, which means to get out the big guns because you want to buy!