Some settings on StockCharts.com can help with exiting a stock based on technical indicators.
Chandelier exits
Chandelier exits can help indecisive investors. Chandelier exits are placed as a line on the chart that is a maximum retracement off the most recent high. As the price moves up, so does the line. Eventually the stock drops in price and kicks you out.Put the overlay on the chart by selecting Chandelier Exits from the Overlays drop-down menu and click Update. Check to see whether the price goes below the line too often. If so, increase the range from 3.0 to 4.0 until the line fits the stock better. Two chandelier exit lines are shown on the panel with the price bars.
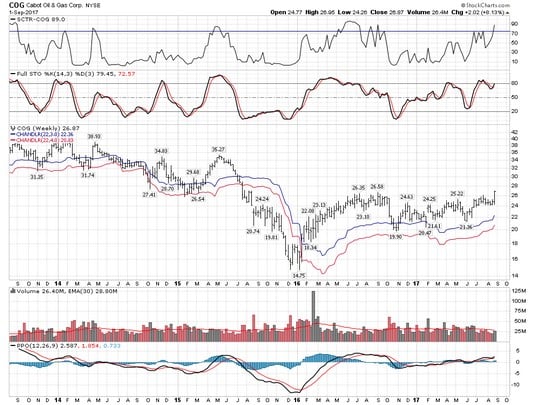 Chart courtesy of StockCharts.com
Chandelier exits.
The Cabot Oil and Gas (COG) weekly chart is shown above. The chandelier exit set at 3.0 would have kicked you out in October 2016, but the setting of 4.0 would have been okay. In that example, changing 3.0 to 4.0, which is four times the average range for a week rather than three times the average range, works better as a setting. However, for most of the downside moves in 2014 and 2015, getting out earlier would have been better.
You may need to eliminate the other moving averages to clearly see the chandelier exit line on your charts, but the actual price level is shown on the legend.
Parabolic stop and reverse
Parabolic stop and reverse, commonly called parabolic SAR, moves the stop closer to the price as the advance continues. Eventually, the stop is very close to the price and kicks a sell signal. Parabolic SAR is found in the Overlays area. The image below shows the default settings for the parabolic SAR. The parabolic SAR dot will move up above the highest price recently recorded and move the system to a sell signal. This system works well on strong trending stocks, but is terrible during sideways consolidations.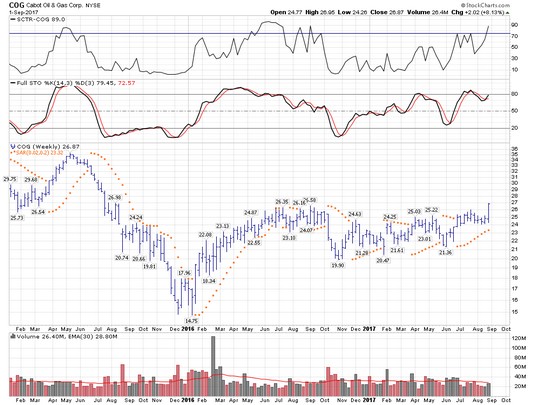 Chart courtesy of StockCharts.com
Parabolic SAR.
For Cabot Oil and Gas, the parabolic SAR was on a sell signal for most of 2015. In 2016, it switched to a very profitable buy signal. However, from June 2016 through most of 2017, the sideways chop was an awful solution, with every trade losing money as a buy-high, sell-low trade. In a full parabolic SAR system, you would short the stock when the system reversed, until the price of the stop was hit to the upside, telling you to go long on the stock.
In this example, shorting the stock would have only doubled your losses in the sideways chop. You don’t have to short the stock; you can just sell the shares you have and wait for another buy signal to trigger on the parabolic SAR or use other indicators you like. For this reason, use the parabolic SAR on strong trending stocks only.
The best rule in trading is to have a stop somewhere. If you don’t have a stop, a downturn can really hurt your year-end profit despite all the wins you may have racked up during the year.