Looking at consolidation basics
Investors rotate in the market among the various different industries depending on the economic climate. A sector can gently move sideways or up without a lot of interest from investors who buy stocks for longer periods of time. Companies that tend to trade sideways often pay a dividend to keep their investors interested in owning the stock, but some investors may be frustrated by the stock’s inability to trend higher.For most investors, a sideways stock is uncomfortable to own. Depending on your buying price, you may be losing money or have a gain in the stock at any given time. As the price stagnates, fewer and fewer investors are interested, so the stock migrates down to the low end of the range. At that point investors see a price level where institutions have bought shares before and may buy more shares. This can create a level of support for the stock. These new investors may buy with an expectation of it going back up to the top of the range and sell it near the top. The cycle starts again.
For example, in 2016, financial stocks rallied hard off major lows in early 2016 after trading sideways for years. In the last quarter of the year, the exchange-traded fund (ETF) in the financial sector, XLF, broke out of the range and shot up 25 percent in a period of five months, topping in March 2017. XLF started to trade down. Four months later, the ETF continued to trade sideways between two levels but back at the top of the range.
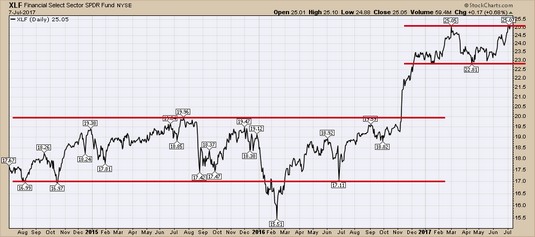 Chart courtesy of StockCharts.com
Consolidation.
For XLF, the ETF had spent almost two years in a trading range that started in 2014. The lows of 2016 forced most investors to reduce their exposure or sell all the shares. When the shares rallied from the lows, the expectation of getting back to $20 might have been there, but the extension to $25 would have been a stretch to imagine.
Seeing the ETF move 60 percent from the lows was a huge move in just over a year, from November 2016 to March 2017. If the price were to again tend to consolidate between $22.50 and $25.50, that would start to frustrate investors again.
Recognizing different periods of consolidation on a chart
While consolidation is frustrating, these periods are also hard to spot until you have seen the range establish itself with multiple lows near a specific level and highs at another level. For this reason, chartists focus on previous lows and previous highs to see how price responds. If the price can continue higher, the top of the range will typically become support. If the price trades lower out of the range, there can be a lot of selling pressure as the price returns back to the lower edge of the previous range.A great example of different types of consolidation can be found in the chart for Shopify (SHOP). The stock came out as an initial public offering in May 2015, so investors had no historical information for the stock price. After a stunning first few days, the stock moved higher for a month with a high around $39. The stock built its first consolidation between $26 and $40.
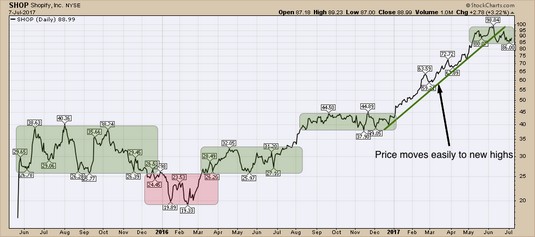 Chart courtesy of StockCharts.com
Different types of consolidation.
Shopify opened at $25 on the first day of trading after pricing the offering at $17. After a few months, sellers were unable to find support at the lower boundary of the consolidation, so the price moved down considerably toward the initial IPO price of $17 trying to attract new buyers.
The stock started to find support again and spent two months trading at this level between $18 and $26. After getting back above the lows of the first consolidation range at $26, the stock consolidated again for almost five months between $26 and $32. From there, the stock moved freely up to $42. It consolidated for five months around the previous highs at $40 by oscillating between $38 and $45.
Then the stock broke above this consolidation to fresh new highs. Everyone who owned the stock was profitable and not really interested in selling. The stock moved unencumbered for months, easily surpassing prior highs with very small pullbacks as new investors stepped in to own the stock. The stock proceeded straight to $100. The stock started to consolidate at this new level for two months.
Reading investor behavior during consolidation
The different types of consolidation in the chart above are great examples of investor behavior:- In the first consolidation, the price ranged between the opening bid and the top of the first surge, testing both multiple times.
- The second consolidation may have been built when large investors bought the stock from the original traders who were in a losing position on the stock. This is referred to as moving into strong hands.
- The third consolidation was still working against the early investors by trading in the low end of the original range. The investors were starting to wonder whether that was all the stock was worth.
- The fourth consolidation moved up to the high end of the original range and teased and tempted investors with higher prices. This level also worked the stock away from investors who just wanted to lock in the profits they had before.
Institutions typically like the sideways consolidation for building larger positions on stocks over a few weeks when they think the stock will go on to new highs. If they buy the stock all at once, they push the price higher. If they buy the stock on down days during consolidations in the price, they can accumulate more before the price accelerates away.
- The final consolidation on the chart shown is where investors were locking in gains of at least 100 percent from the fourth consolidation.
To book profits, you have to sell some of the position to record gains.