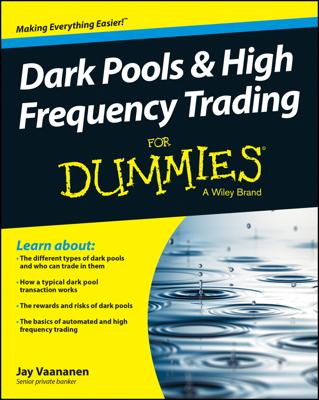
Sometimes the trading market delivers a price bar that looks like the investment activity went crazy that day. This creates a spike, where the high or the low is very far away from the general trend of things and the bar itself is abnormally large (wide high–low range).
In some cases, like that shown in the following example, a spike turns out to be an anomaly. The spike low suggests that some people panicked and were selling at such a high quantity and at such a frantic pace that the few buyers still around were able to buy at abnormally low prices. On this chart, the sellers panicked unnecessarily. The next day, the price resumed its uptrend and its same “normal” high–low range. The spike was just an oddity — a random move.
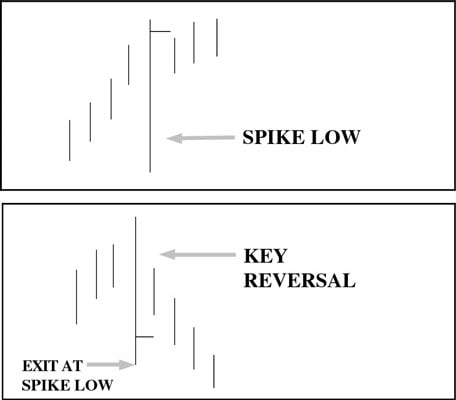
The bottom spike example is a key reversal because on the next few days, the price proceeded to make lower highs and lower lows. This spike in the size of the daily high–low range was a warning of a reversal. Key reversals can be ordinary bars and aren’t always spikes, but when you see a spike, always ask yourself whether it may mark a reversal.
You seldom know whether a spike is random or meaningful on the day that it happens. Only hindsight can tell you that. Though hindsight has the final say on the meaning of a spike, you can still use spikes for immediate analytical purposes:
Investigate the environment: Sometimes you do know when a spike is a key reversal because you can determine what shock caused it and your judgment in interpreting the news or event is sound.
Trust the close: As a general rule, you’re safe assuming that the close is the most important part of the bar because it sums up the sentiment for the day.
A key reversal bar is also called a swing bar, although not all swing bars are spikes. A swing bar is any bar that is the final and lowest low in a series of lower lows or the final and highest high in a series of higher highs, as in the bottom chart in the figure. You can see a spike bar at the end of the day after the close, but you can’t identify it as a swing bar until after two additional closes.