
For energy investors to successfully trade oil and gas futures, understanding the basic drivers behind oil and gas prices is imperative. In a perfect world, a market’s fundamentals would revolve entirely around demand. That is, you have a buyer with a specific amount in mind, willing to pay a certain price.
Rarely, however, is that the case. You’ve seen firsthand that oil and natural gas prices aren’t set in stone. One day you fill up your gas tank for $4 per gallon, and the next day you regret the decision because prices are suddenly 20 cents cheaper.
Three basic factors are at work here: a mishmash of supply, demand, and market opinion (from both a geopolitical and technical perspective) that come together to shape prices over the short and long term.
An economics professor would tell you that everything comes down to supply and demand and that price is simply a reflection of the relationship between the two. In a nutshell, higher supply leads to lower prices and vice versa.
By now, you should know that oil markets don’t play by the usual rules. How high the price at the pump climbs doesn’t matter because, chances are, your car (and more than 90 percent of the transportation sector) won’t run on a different fuel at the drop of a hat.
If your house runs on heating oil, that leaves you relatively few options during the winter months — buy more heating oil or pay to switch fuels. You can lower the thermostat, but you’re still going to heat your home.
Supply
It takes different crudes to move the world, and not all crudes were created equal. You may only be familiar with the top grades of crude: West Texas Intermediate (WTI) and Brent Blend from the North Sea.
The quality of crude oil is based on its American Petroleum Institute (API) gravity, which measures the weight of the liquid compared to water. Typically, having an API gravity higher than 10 indicates that the crude is lighter than water. Anything less than 10 is heavier and sinks.
The sulfur content of crude oil is also measured. When it has a sulfur level of more than 0.5 percent, it’s considered sour. Anything less than 0.42 percent sulfur is considered sweet. Overall, light, sweet grades of crude are more desirable for refineries because they’re cheaper and easier to refine.
In total, there are more than 100 different grades and types of crude oil. This table is a list of some of the more familiar ones found within the United States.
| Type | API Gravity | Sulfur Content |
|---|---|---|
| Alaska North Slope | 31.9 | 0.93% |
| Bakken Blend | 42.0 | 0.17% |
| Bayou Choctaw Sour | 32.2 | 1.43% |
| Bayou Choctaw Sweet | 36.0 | 0.36% |
| Bonito Sour | 35.5 | 0.99% |
| Heavy Louisiana Sweet | 32.9 | 0.35% |
| LA Mississippi Sweet | 40.7 | 0.34% |
| Light Louisiana Sweet | 35.6 | 0.37% |
| Mars Blend | 30.3 | 1.91% |
| Port Hudson | 45.0 | 1.97% |
| South Louisiana Sweet | 35.9 | 0.33% |
| West Texas Intermediate | 39.6 | 0.24% |
| West Texas Sour | 31.7 | 1.28% |
| Williams Sugarland Blend | 40.9 | 0.20% |
For a long time, West Texas Intermediate was considered the global benchmark for crude oil. Its top quality makes it ideal for refiners to produce gasoline. Location is an added bonus — WTI is produced close to the Midwest refiners, as well as those found along the Gulf Coast area.
Members of the Organization of Petroleum Exporting Countries (OPEC) control about 80 percent of the world’s oil reserves. The OPEC reference basket is also used as an important benchmark for oil prices. It’s the average of prices for its members’ crude blends, which you can find in this table. OPEC publishes its basket price daily on its website.
| Crude Blend | Country |
|---|---|
| Saharan Blend | Algeria |
| Girassol | Angola |
| Oriente | Ecuador |
| Iran Heavy | Iran |
| Basra Light | Iraq |
| Kuwait Export | Kuwait |
| Es Sider | Libya |
| Bonny Light | Nigeria |
| Qatar Marine | Qatar |
| Arab Light | Saudi Arabia |
| Murban | United Arab Emirates |
| Merey | Venezuela |
Within the last few years, Brent Blend crude oil successfully replaced WTI as the global benchmark for crude pricing. The two have historically traded relatively close, but the price gap began to widen in 2010, and Brent now trades at a considerable $15 per barrel premium to WTI. This figure shows the price divergence since 2007.
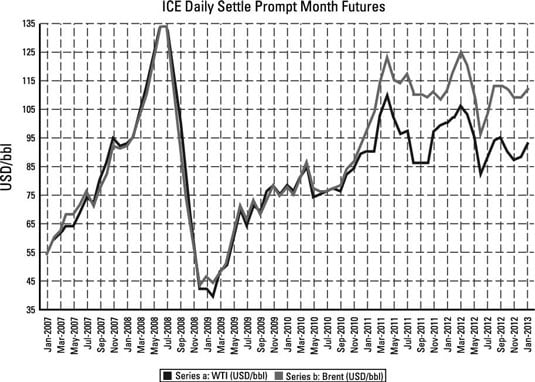
Although it usually comes down to who you ask, it seems that more analysts and government reporting agencies are starting to accept that Brent crude is a better reflection of a global price benchmark. In fact, the EIA adopted Brent crude for its price forecasts for the first time in its Annual Energy Outlook 2013.
Brent Blend is made up of production from about 15 different fields in the North Sea. The API gravity of Brent crude is 38.3, with a 0.37 percent sulfur content. In other words, it’s not exactly as light as WTI.
Demand
Contrary to popular belief, future demand growth for crude oil won’t come from the United States. America may account for one-quarter of global demand today, but that dynamic is going to change dramatically over the course of a few decades.
The largest growth will come from countries outside the Organisation for Economic Co-operation and Development (OECD), specifically from China, India, and countries in the Middle East. This demand growth is illustrated in this figure, which is taken directly from BP’s Energy Outlook 2030 report.
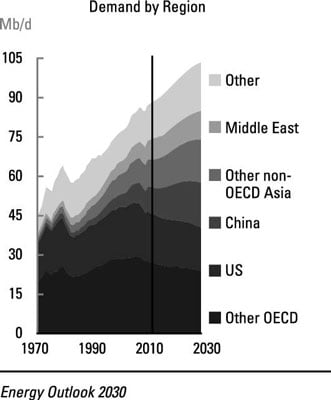
There’s a good reason why demand slows or declines in these developed countries. Oil and liquids demand is centered on the transportation sector. Countries with high consumption rates (like the United States) experience a decline in demand for various reasons, such as better vehicle efficiency or the substitution of other fuels in place of oil.
In non-OECD countries like China, for example, total liquids demand is projected to reach 17 million barrels per day (mb/d) in 2030, nearly double its current consumption rate.