In Common Core math, students start to focus on the number 10 when they hit first grade. They start to count by tens and decompose ten. They also decompose other numbers in relation to ten (for example, 12 is 10 + 2; 13 is 10 + 3).
This important role of ten is highlighted in the classroom through a number of representations and activities, including the following:
Linking cubes: Students may use linking cubes to show groups of ten. They may grab a couple of handfuls of these cubes, link them together in groups of ten, and leave the remaining cubes loose. This exercise helps to emphasize that (say) 26 has two groups of ten and six leftovers (refer to example a in the figure).
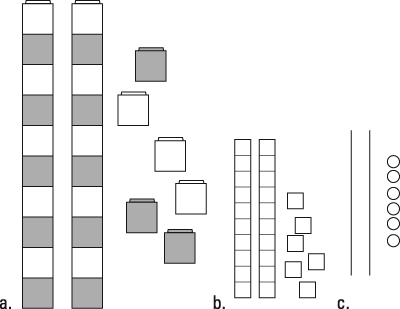 The number 26 is represented with linking cubes (a), base-ten blocks (b), and circles and lines (c).
Base‐ten blocks: Sometimes called Dienes blocks, after the mathematician Zoltan Dienes, or place‐value blocks, these small cubes (shown as example b in the figure) represent ones, sticks made of ten cubes represent tens, flat squares made of ten sticks represent hundreds, and so on. Each power of ten gets a new unit. Students don't assemble the cubes to make the sticks but trade ten cubes for one stick or vice versa. Doing so mimics the carrying and borrowing that are part of the standard addition and subtraction algorithms in the United States. Carrying and borrowing are also called regrouping or trading; these words refer to those little 1s you probably write above the numbers as you add or subtract on paper.
Circles and lines: As a quick way to record the work that they do with cubes, students may draw small circles for the ungrouped units and line segments for the sticks of cubes. (Example c in the figure shows these lines and cubes.) Unlike the cubes, there isn't a proportional relationship in these circles and lines. Instead, the circles and lines refer to the 1:10 relationship that students have expressed with cubes.
Hundreds chart: A hundreds chart is organized as 100 squares in ten rows and ten columns. The numbers 1–10 are in the first row, 11–20 in the second row, and so on with 100 in the bottom-right corner. The next figure shows an example of a hundreds chart.
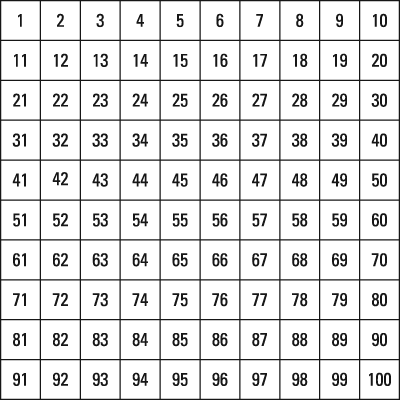 A ten-by-ten hundreds chart.
Many interesting ten‐related patterns are in the hundreds chart. For example, the ones digit in each column is constant, while the tens digit is constant in each row (except for the last number in each row). As students begin to work on addition and subtraction, they can use a hundreds chart to notice that adding ten is equivalent to moving down one row. Therefore doing so leaves the ones digit constant while increasing the tens digit by 1.