
The distribution of a statistical data set (or a population) is a listing or function showing all the possible values (or intervals) of the data and how often they occur. When a distribution of categorical data is organized, you see the number or percentage of individuals in each group. When a distribution of numerical data is organized, they’re often ordered from smallest to largest, broken into reasonably sized groups (if appropriate), and then put into graphs and charts to examine the shape, center, and amount of variability in the data.
The world of statistics includes dozens of different distributions for categorical and numerical data; the most common ones have their own names. One of the most well-known distributions is called the normal distribution, also known as the bell-shaped curve. The normal distribution is based on numerical data that is continuous; its possible values lie on the entire real number line. Its overall shape, when the data are organized in graph form, is a symmetric bell-shape. In other words, most (around 68%) of the data are centered around the mean (giving you the middle part of the bell), and as you move farther out on either side of the mean, you find fewer and fewer values (representing the downward sloping sides on either side of the bell).
Due to symmetry, the mean and the median lie at the same point, directly in the center of the normal distribution. The standard deviation is measured by the distance from the mean to the inflection point (where the curvature of the bell changes from concave up to concave down).
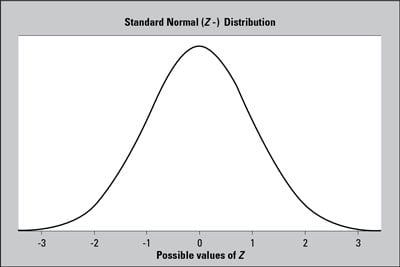
This figure shows a graph of a normal distribution with mean 0 and standard deviation 1 (this distribution has a special name, the standard normal distribution or Z-distribution). The shape of the curve resembles the outline of a bell.
Because every distinct population of data has a different mean and standard deviation, an infinite number of normal distributions exist, each with its own mean and its own standard deviation to characterize it.