Using Columns and Bars to Compare Items in Excel Charts
In Excel charts, using columns and bars is a great way to compare items side-by-side. Column and Bar charts also handle multiple data series — a key point when considering which Excel chart type to use. Column and Bar charts are effectively the same. The difference is that Column charts display vertical columns and Bar charts display horizontal bars. On a Column chart, the values are on the vertical (y) axis, while on a Bar chart, the values are on the horizontal (x) axis. They each process data the same way.
Making a Column chart
The first task when making a Column chart is to plot the data:
1. Select the data, including both series and headers (all three columns).
2. Click the Chart Wizard button on the Standard toolbar or choose Insert --> Chart.
The Chart Wizard opens with the Column chart type selected by default. It doesn't get any easier than that!
Figure 1 shows the Chart Wizard with the Column chart type selected, and the first subtype. This is what you want.
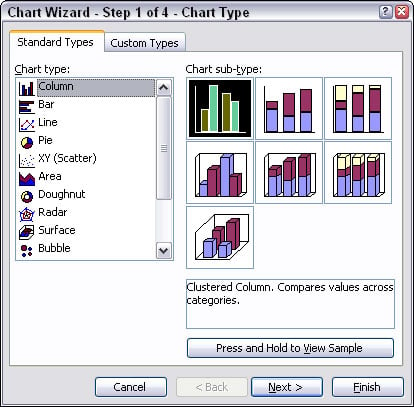
Figure 1: Selecting a Column chart.
3. Click the Next button twice.
The Chart Wizard should now be on Step 3.
4. Click the Titles tab.
5. Enter an appropriate title for the chart.
The example uses the title Summer Vacation Packages Sold. Adding a title is optional, but it's proper chart etiquette.
6. Click Finish.
Figure 2 shows how the chart turned out. The categories (the cities) are correctly placed under the category axis. The legend clues you in to which column represents which data series. This is made possible by the fact that each data series has its own color.
There always must be a way to differentiate multiple series. This is accomplished by applying formatting attributes — color, patterns, line styles, markers, and so on. Each series is somehow uniquely formatted.
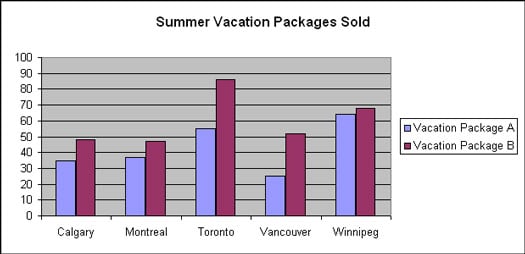
Figure 2: Reviewing the number of sold vacation packages.
The chart in Figure 2 shows how the individual data points, from the two data series, are anchored to their respective categories. The two data series are differentiated by color. This chart makes it easy to see a few key points about the data:
- Winnipeg sold the most of Vacation Package A, and Toronto sold the most of Vacation Package B.
- Overall, Calgary and Montreal performed very similarly.
- Winnipeg sold almost an even amount of A and B packages.
In other words, the Column chart in Figure 2 makes it easy to compare values, whether comparing multiple series per category, or comparing across categories. For example, you can easily see that Toronto outperformed all other cities with regard to Vacation Package B.
Changing the chart type to a Bar chart
A Bar chart presents data in the same way as a Column chart, but it does so horizontally instead of vertically. Here's what you do to change the chart type:
1. Click once on the chart to select it, if it is not already selected.
The menu bar now displays the Chart menu item where the Data menu item usually is found. Figure 3 shows the Chart menu with its various submenus.
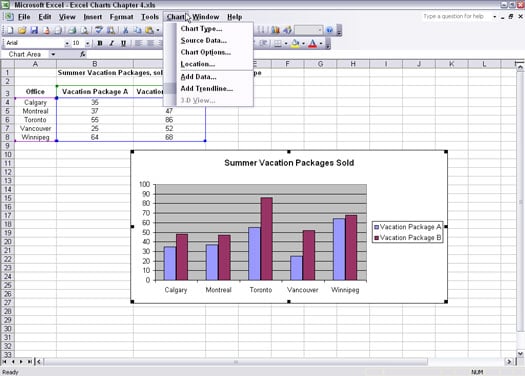
Figure 3: Accessing the Chart menu item.
2. Choose Chart --> Chart Type.
The Chart Type dialog box opens, as shown in Figure 4.
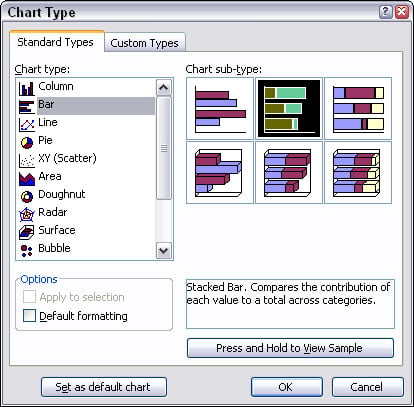
Figure 4: Changing the chart type.
3. Select the Bar chart type, and the first subtype (Clustered Bar).
4. Click OK.
Presto! The Column chart is now a Clustered Bar chart. Figure 5 shows the result of all this effort (hardly an effort at all!). The values of the two vacation packages are still anchored to their respective categories, now along the vertical axis.
A Bar chart typically has the categories on the vertical axis and the values on the horizontal axis.
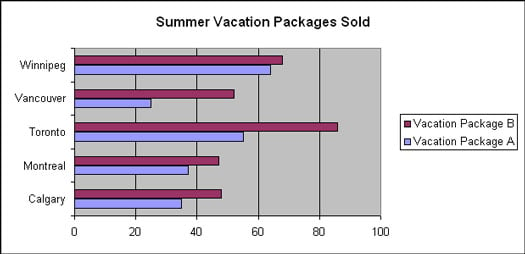
Figure 5: Displaying the data in a Bar chart.

Excel Glossary
active cell
The worksheet cell that contains the cell cursor. Each worksheet can have only one active cell.

Excel Glossary
AutoComplete
A feature that looks at the entries that you make in a worksheet column and automatically duplicates them in subsequent rows whenever you start a new entry that begins with the same letter or letters as an existing entry in that column.

Excel Glossary
AutoCorrect
A feature that alerts Excel 2007 to common typing errors and your own typing errors (that you specify) and tells the program how it should automatically fix them for you.

Excel Glossary
AutoFill
An Excel 2007 feature that quickly creates a series of entries based on the data you enter in one or two cells. AutoFill works with days of the week, months of the year, yearly quarters; consecutive series of numbers; and formulas. You also can add your own custom AutoFill series.

Excel Glossary
AutoFilter
A feature in Excel 2010 that enables you to temporarily hide everything in a table except the records you specifically want to view, based on criteria you specify.

Excel Glossary
Backstage view
A new feature in Excel 2010 — accessible from the green File tab — that enables you to manage files and to view the properties and stats about the workbook file you're editing.

Excel Glossary
cell
The intersection of a column and row in the worksheet.

Excel Glossary
cell address
The cell identifier, determined by its column letter(s) followed by the row number, as in cell A1, the very first cell of each worksheet at the intersection of column A and row 1.

Excel Glossary
cell cursor
The black border that surrounds the active cell in a worksheet.

Excel Glossary
clip art
Readymade drawings, illustrations, and photos offered by Microsoft for use in Microsoft Office applications.

Excel Glossary
Compatibility Checker
A utility in Excel 2007 and 2010 that you use to find potential compatibility issues if you plan to save an Excel workbook file in the older Excel 97–2003 file format.

Excel Glossary
current cell
The worksheet cell that contains the cell cursor. Each worksheet can have only one current cell.

Excel Glossary
data table
A range of cells in a worksheet in which you enter a series of possible values that Excel plugs into a formula so you can perform what-if analysis on the data.

Excel Glossary
dialog box
A rectangular window with settings and commands that appears when you click a dialog box launcher or certain other commands on the Ribbon.

Excel Glossary
dialog box launcher
A small icon in the lower-right corner of a group of command buttons on the Ribbon that you click to access a dialog box with additional related settings and commands.

Excel Glossary
function
A part of a formula that takes a number of specific arguments and then returns a single value based on those arguments.

Excel Glossary
gallery
A drop-down list of thumbnail selections that appears when you click certain command buttons on the Ribbon.

Excel Glossary
group
A section of a tab on the Excel 2007 Ribbon that organizes related command buttons into subtasks normally performed as part of the tab's larger core task. The name of a group appears at the bottom of the group, such as the Font group on the Home tab.

Excel Glossary
hyperlink
Specially formatted text that anyone can click to jump to Web sites, move to other cells or workbooks, or create an e-mail message.

Excel Glossary
keyboard shortcuts
A combination of keys that you can press to execute certain commands, as opposed to finding and clicking the commands' buttons on the Ribbon or elsewhere.

Excel Glossary
Live Preview
A feature in Excel 2007 that enables you to point to thumbnails on a drop-down gallery to see how a new font, font size, table style, or cell style would look on your selected data before you actually apply it.

Excel Glossary
macro
A series of commands or actions in Excel that are recorded and saved together in a file. You can run the macro whenever you need to perform the task.

Excel Glossary
Name box
The left-most section of the Formula bar that displays the address or name of the current cell.

Excel Glossary
pivot table
A special type of table unique to Excel 2007 that enables you to summarize large amounts of data and pivot or rearrange the table's data to display different summaries of the information it contains.

Excel Glossary
Ribbon
A new feature of the Excel 2007 interface that replaces the menus and toolbars of previous versions; appears at the top of the Excel window, just below the title bar.

Excel Glossary
ScreenTip
A small window that displays descriptive text when you point to but don't click a command on the Ribbon or other objects in a worksheet.

Excel Glossary
sheet tabs
Small tabs near the bottom of a worksheet that you click to move between the worksheets in a workbook. You can assign descriptive names to sheet tabs.

Excel Glossary
slicers
New graphic objects in Excel 2010 that enable you to quickly filter the contents of a PivotTable on more than one field.

Excel Glossary
SmartArt
A type of graphic object in Excel 2007 that gives you the ability to quickly and easily construct graphical lists and diagrams in the worksheet.

Excel Glossary
sparklines
Tiny graphs (miniature charts) that fit within a single cell in the worksheet, used to show basic trends in data.

Excel Glossary
Status bar
A horizontal bar that appears at the bottom of the Excel 2007 window and keeps you informed of Excel's current mode. In addition, you can use the Status bar to select a new worksheet view and to zoom in and out on the worksheet.

Excel Glossary
tabs
The various "pages" of Excel 2007's Ribbon interface that you click to display command buttons relating to the tab's name, such as Page Layout and Formulas.

Excel Glossary
template
A pre-designed worksheet that can be used as a basis for creating new worksheets.

Excel Glossary
WordArt
Stylized text objects that you use to add pizzazz and emphasis to headings and other text in Excel 2007 worksheets.

Excel Glossary
workbook
The basic file type that you create when you use Excel 2007. A new workbook consists of three worksheets by default.

Excel Glossary
worksheet
The main document that you work in when you enter data into cells within Excel 2007. A worksheet is stored in a workbook file.

Excel Glossary
worksheet area
The portion of an Excel 2007 worksheet in which you enter cell data and add objects such as charts and graphics.

Excel Glossary
XPS XML Paper Specification
A file format developed by Microsoft that enables people to open and print documents in XPS Reader without access to the original programs with which the documents were created (such as Excel).

Excel Glossary
Zoom slider
An object on the Status bar in Excel 2007 that enables you to increase the magnification in a worksheet or shrink it down to get an overall picture of the worksheet data.