
The graphs of trig functions can be useful for showing natural cycles over time, such as temperature and population change. The following graph shows the population of a herd of deer, starting at the first of April and ending at the next April. New deer are born in the spring, so an increase in the herd size is expected. Predators take care of the weak deer — both young and old. And then you have to consider the weather; winter can be very hard on the population.
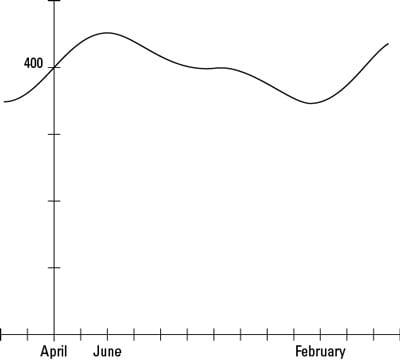
Look at the graph in the figure and see if it demonstrates what you’d expect. This cycle is the result of finding the sum of two different sine functions: D(m) = 400 + 40sin (0.524m) + 20sin (1.047m). The D represents the population of the herd, and m is the number of months since April.
The herd experiences a high of about 450 deer in June and a low of about 350 deer in February. This model shows a herd that stays pretty close to being the same size year after year. This probably doesn’t reflect what we see along the roadways; increasing deer populations seem to be a problem in many areas.