


Biostatistics can be surprising sometimes: Data obtained in biological studies can often be distributed in strange ways, as you can see in the following frequency distributions:
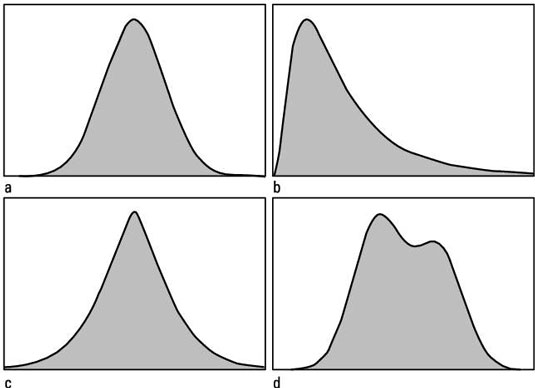
Two summary statistical measures, skewness and kurtosis, typically are used to describe certain aspects of the symmetry and shape of the distribution of numbers in your statistical data.
Skewness
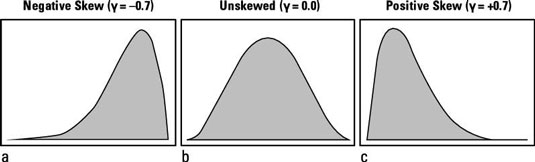
Skewness refers to whether the distribution has left-right symmetry or whether it has a longer tail on one side or the other. Many different skewness coefficients have been proposed over the years. The most common one, often represented by the Greek letter lowercase gamma (γ), is calculated by averaging the cubes (third powers) of the deviations of each point from the mean, and then dividing by the cube of the standard deviation. This gives a dimensionless coefficient (one that is independent of the units of the observed values), which can be positive, negative, or zero.
A negative skewness coefficient (lowercase gamma) indicates left-skewed data (long left tail); a zero gamma indicates unskewed data; and a positive gamma indicates right-skewed data (long right tail).
Of course, the skewness coefficient for any set of real data almost never comes out to exactly zero because of random sampling fluctuations. So how large does gamma have to be before you suspect real skewness in your data? A very rough rule of thumb for large samples is that if gamma is greater than
your data is probably skewed.
Kurtosis
The three distributions shown below happen to have the same mean and the same standard deviation, and all three have perfect left-right symmetry (that is, they are unskewed). But their shapes are still very different. Kurtosis is a way of quantifying these differences in shape.
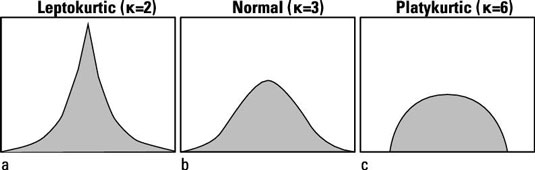
If you think of a typical distribution function curve as having a "head" (near the center), "shoulders" (on either side of the head), and "tails" (out at the ends), the term kurtosis refers to whether the distribution curve tends to have
A pointy head, fat tails, and no shoulders (leptokurtic)

Normal appearance

Broad shoulders, small tails, and not much of a head (platykurtic)

The Pearson kurtosis index, often represented by the Greek letter kappa, is calculated by averaging the fourth powers of the deviations of each point from the mean and dividing by the fourth power of the standard deviation. It is a dimensionless coefficient (is independent of the units in which the original data was expressed). Its value can range from 1 to infinity and is equal to 3.0 for a normal distribution.
The excess kurtosis is the amount by which kappa exceeds (or falls short of) 3. A very rough rule of thumb for large samples is that if kappa differs from 3 by more than
your data probably has abnormal kurtosis.

