
The power of a statistical test is the chance that it will come out statistically significant when it should — that is, when the alternative hypothesis is really true. Power is a probability and is very often expressed as a percentage. Beta is the chance of getting a nonsignificant result when the alternative hypothesis is true, so you see that power and beta are related mathematically: Power = 1 – beta.
The power of any statistical test depends on several factors:
The alpha level you've established for the test — that is, the chance you're willing to accept of making a Type I error
The actual magnitude of the effect in the population, relative to the amount of noise in the data
The size of your sample
Power, sample size, effect size relative to noise, and alpha level can't all be varied independently; they're interrelated — connected and constrained by a mathematical relationship involving the four quantities.
This relationship is often very complicated, and sometimes it can't be written down explicitly as a formula, but it does exist. For any particular type of test, you can (at least in theory) determine any one of the four quantities if you know the other three. So there are four different ways to do power calculations, with each way calculating one of the four quantities from arbitrarily specified values of the other three.
Power, sample size, and effect size relationships
The alpha level of a statistical test is usually set to 0.05, unless there are special considerations. After you specify the value of alpha, you can display the relationship between the other three variables (power, sample size, and effect size) in several ways:
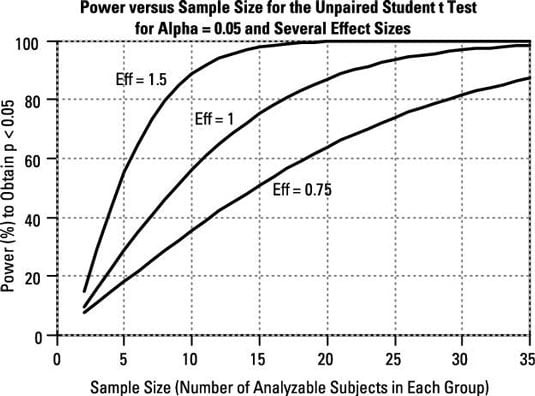
Power versus sample size, for various effect sizes: For all statistical tests, power always increases as the sample size increases, if other things (such as alpha level and effect size) are held constant. "Eff" is the effect size — the between-group difference divided by the within-group standard deviation.
Very small samples very seldom produce significant results unless the effect size is very large. Conversely, extremely large samples (many thousands of subjects) are almost always significant unless the effect size is near zero. In epidemiological studies, which often involve hundreds of thousands of subjects, statistical tests tend to produce extremely small (and therefore extremely significant) p values, even when the effect size is so small that it's of no practical importance.
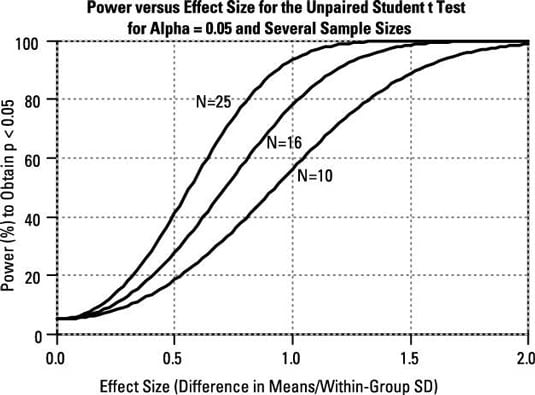
Power versus effect size, for various sample sizes: For all statistical tests, power always increases as the effect size increases, if other things (such as alpha level and sample size) are held constant. "N" is the number of subjects in each group.
For very large effect sizes, the power approaches 100 percent. For very small effect sizes, you might think the power of the test would approach zero, but you can see from the figure that it doesn't go down all the way to zero; it actually approaches the alpha level of the test.
(Keep in mind that the alpha level of the test is the probability of the test producing a significant result when no effect is truly present.)
Sample size versus effect size, for various values of power: For all statistical tests, sample size and effect size are inversely related, if other things (such as alpha level and power) are held constant. Small effects can be detected only with large samples; large effects can often be detected with small samples.
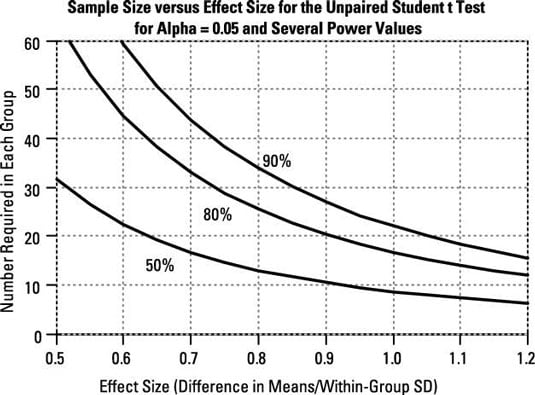
This inverse relationship between sample size and effect size takes on a very simple mathematical form (at least to a good approximation): The required sample size is inversely proportional to the square of the effect size that can be detected.
Or, equivalently, the detectable effect size is inversely proportional to the square root of the sample size. So, quadrupling your sample size allows you to detect effect sizes only one-half as large.
How to do power calculations
Power calculations are a crucial part of the design of any research project. You don't want your study to be underpowered (with a high risk of missing real effects) or overpowered (larger, costlier, and more time-consuming than necessary). You need to provide a power/sample-size analysis for any research proposal you submit for funding or any protocol you submit to a review board for approval.
You can perform power calculations in several ways:
Computer software: The larger statistics packages (such as SPSS, SAS, and R) provide a wide range of power calculations. There are also programs specially designed for this purpose (nQuery, StatExact, Power and Precision, PS-Power & Sample Size, and Gpower, for instance).
Web pages: Many of the more common power calculations can be performed online using web-based calculators. A large collection of these can be found at StatPages.net.
Hand-held devices: Apps for the more common power calculations are available for most tablets and smartphones.
Printed charts and tables: You can find charts and tables in textbooks. These are ideal for quick and dirty calculations.
Rules of thumb: Some approximate sample-size calculations are simple enough to do on a scrap of paper or even in your head!