
In managerial economics, the relationship between how much customers must pay for an item and how much customers buy is called demand. More precisely, demand shows the relationship between a good’s price and the quantity of the good customers purchase, holding everything else constant.
Wow! Holding everything else constant, even the dog’s waggley tail? Not quite, but holding things like income, customer preferences, and the price of other goods — say cats — constant. (Are cats a good?)
So quite simply, demand tells you how much customers purchase at each possible price.
How to distinguish between quantity demanded and demand
Quantity demanded and demand sound like the same thing. Indeed, as you read the newspaper, you’re likely to see demand all the time and never see quantity demanded. (That’s because very few reporters take economics classes.) But to economists, there is a big difference between the terms quantity demanded and demand.
To economists, quantity demanded is the amount of the good customers purchase at a given price. Quantity demanded is a specific number.
On the other hand, demand refers to the entire curve. Demand shows how much is purchased at every possible price.
Demand is an equation or line on a graph that indicates how price and quantity demanded are related.
How to graph demand
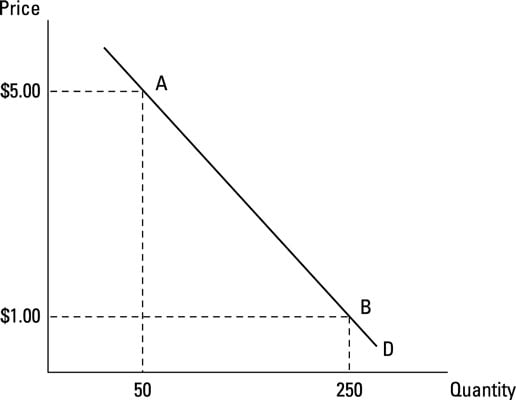
The graph of the demand curve enables you to focus on the relationship between price and quantity demanded. The graph shows you that when prices are very high, customers want to buy fewer treats. More specifically, if the price of treats is $5.00, customers want to buy only 50 boxes of treats a week.
On the other hand, if the price of treats decreases, say, to $1.00 a box, the quantity demanded of treats increases to 250 boxes a week.
Price changes
Price changes cause movements along the demand curve, or a change in quantity demanded. When the price of dog treats decreased from $5.00 to $1.00, the quantity demanded increased from 50 to 250 boxes per week — a movement from point A to point B on the demand curve.
An inverse relationship exists between price and quantity demanded — price and quantity demanded move in opposite directions.
A shift of the demand curve
When one of the things being held constant — income, tastes, and the prices of other goods — changes, the entire demand curve shifts. For example, advertisements indicate that treats lead to happy dogs. People want happy dogs, so their preference for treats changes; dog treats become more desirable. So more dog treats are purchased, even though nothing happened to the price of dog treats.
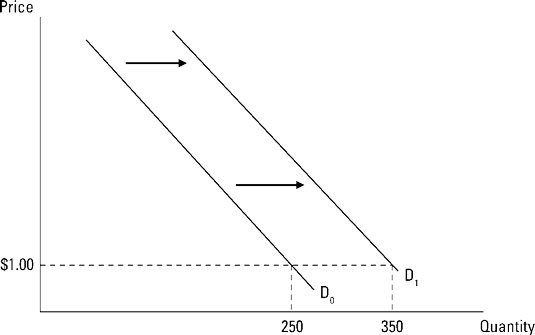
Because the desirability of dog treats increases, stores are selling a lot more dog treats. Stores were previously selling 250 boxes of treats per week at a price of $1.00. Now, with the price still $1.00, stores are selling more treats — 350 boxes a week. That point isn’t on the original demand.
What happened is the demand curve shifts so that this new point is on the new demand curve, D1. Because the new demand curve is to the right of the original demand curve, economists say demand has increased.
Any rightward shift in the demand curve is an increase in demand, and any leftward shift in the curve is a decrease in demand.
The factors that shift the entire demand curve are
Consumer tastes or preferences: A direct relationship exists between desirability (consumer tastes) and demand. Thus, an increase in desirability increases demand.
Income: Income’s impact on demand is a little more complicated. Economists note two types of goods — normal goods and inferior goods. For normal goods, a direct relationship exists between income and demand — an increase in income increases demand. This is the expected, or normal, relationship. For an inferior good, an increase in income decreases demand; therefore, an inverse relationship exists between income and demand for an inferior good.
Prices of other goods: Changes in the prices of other goods are also a little complicated. If the goods are consumer substitutes for one another, they are used interchangeably. For example, a direct relationship exists between one good’s price (hot dogs) and the demand for the second, substitute, good (hamburgers). Thus, when the price of hot dogs increases, the entire demand curve for hamburgers shifts to the right (increases).
Consumer complements are a second type of goods. Consumer complements are used together, such as coffee and cream. An inverse relationship exists between one good’s price and the demand for its consumer complement. As the price of coffee increases, the amount of coffee you drink decreases. This decrease in the quantity demanded of coffee is because you’re responding to a change in coffee’s price.
Because you’re drinking less coffee, your demand for cream also decreases. The higher price for coffee decreases your demand for cream — an inverse relationship. Even if the price of cream doesn’t change, you use less of it.