It may be the case that there is no real relationship between the dependent and independent variables; simple regression generates results even if this is the case. It is, therefore, important to subject the regression results to some key tests that enable you to determine if the results are reliable.
The coefficient of determination, R2, is a statistical measure that shows the proportion of variation explained by the estimated regression line. Variation refers to the sum of the squared differences between the values of Y and the mean value of Y, expressed mathematically as

R2 always takes on a value between 0 and 1. The closer R2 is to 1, the better the estimated regression equation fits or explains the relationship between X and Y.
The expression

is also known as the total sum of squares (TSS).
This sum can be divided into the following two categories:
-
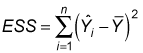
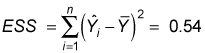
Explained sum of squares (ESS): Also known as the explained variation, the ESS is the portion of total variation that measures how well the regression equation explains the relationship between X and Y.
You compute the ESS with the formula
-
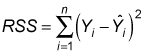
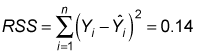
Residual sum of squares (RSS): This expression is also known as unexplained variation and is the portion of total variation that measures discrepancies (errors) between the actual values of Y and those estimated by the regression equation.
You compute the RSS with the formula
-
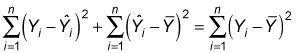
Total sum of squares (TSS):
The sum of RSS and ESS equals TSS.
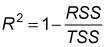
R2 is the ratio of explained sum of squares (ESS) to total sum of squares (TSS):

You can also use this formula:
Based on the definition of R2, its value can never be negative. Also, R2 can't be greater than 1, so

The coefficient of determination is used as a measure of how well a regression line explains the relationship between a dependent variable (Y) and an independent variable (X). The closer the coefficient of determination is to 1, the more closely the regression line fits the sample data.
The coefficient of determination is computed from the sums of squares. These calculations are summarized in the following table.
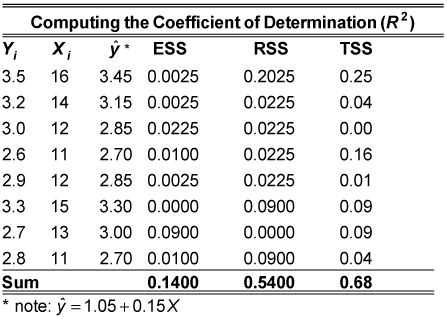
To compute ESS, you subtract the mean value of Y from each of the estimated values of Y; each term is squared and then added together:
To compute RSS, you subtract the estimated value of Y from each of the actual values of Y; each term is squared and then added together:
To compute TSS, you subtract the mean value of Y from each of the actual values of Y; each term is squared and then added together:
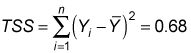
Alternatively, you can simply add ESS and RSS to obtain TSS:
TSS = ESS + RSS = 0.54 + 0.14 = 0.68
The coefficient of determination (R2) is the ratio of ESS to TSS:
This shows that 79.41 percent of the variation in Y is explained by variation in X. Because the coefficient of determination can't exceed 100 percent, a value of 79.41 indicates that the regression line closely matches the actual sample data.