
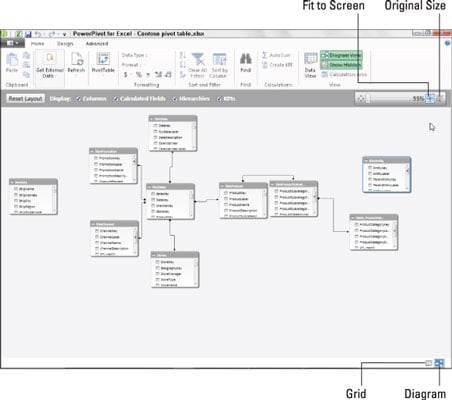
Diagram View is among the most useful features for data modeling offered by the Excel 2013 PowerPivot add-in. When you switch from the default Data View to Diagram View either by clicking the Diagram View button on the Ribbon or the Diagram button in the lower-right corner, all the data tables used in the Data Model are graphically displayed in the PowerPivot window.
Each data table graphic object is labeled by name on its title bar and displays within it a list of all its fields. To see all the fields within a particular table, you may have to resize it by dragging the mouse or Touch pointer at its corners or midpoints.
To avoid obscuring a data table below when enlarging a table located above it to display more of its fields, you can move either the upper or lower data table out of the way by dragging it by its title bar.
In addition to graphic representations of all data tables in the current Data Model, the Diagram View shows all existing relationships between them. It does this by drawing connecting lines between each of the related tables.
The data table containing the primary key field is indicated by a dot at the end of its connecting line and the table containing the foreign key by an arrowhead at the end of its line. To see the name of the key field in each related table, simply click the connecting line: PowerPivot then selects the fields in both tables indicated by surrounding them with blue outlines.
Not only can you easily review the relationships between data tables in Diagram View, but you can also modify them. The most usual way is to create relationships between unrelated tables by locating their key fields and then literally drawing a line between the tables.
To locate fields shared by two data tables in the PowerPivot diagram in either a one-to-one or one-to-many relationship, you can expand the data table graphics to display the entire list of their fields as well as use the Zoom slider at the top of the window beneath the Ribbon to zoom in and out on the tables. (To see all the tables at once, click the Fit to Screen button on the Zoom slider.)
In addition to visually locating shared fields, you can also use PowerPivot’s search feature (by clicking the Find button on the Home tab) to search for particular field names. When you locate two tables that share a field that might work as a key field, you can relate them simply by dragging a line from the potential key field in one table to the key field in the other.
When you release the mouse button or remove your finger or stylus on a touchscreen device, Excel draws a blue outline between the tables indicating the new relationship based on the two shared fields.
If the shared fields don’t represent a one-to-one or one-to-many relationship because the values in one or both are not unique, Excel displays an alert dialog box indicating that the PowerPivot is not able to establish a relationship between your tables. In such a case, you are forced to find another data table in the Data Model that contains the same field, but this time with unique values (that is, no duplicates).
If no such field exists, you’ll be unable to add to the table in question to the Data Model and, as a result, your Excel pivot table won’t be able to summarize its data.
To make it easier to draw the line that creates the relationship between two data tables with a shared key field, you should position the tables near one another in the Diagram View. Remember that you can move the data table graphic objects around in the PowerPivot window simply by dragging them by their title bars.