The problems here focus on calculating, interpreting, and comparing standard deviation and variance in basic statistics. Solve the following problems about standard deviation and variance.
Sample questions
What does the standard deviation measure?
Answer: how concentrated the data is around the mean
A standard deviation measures the amount of variability among the numbers in a data set. It calculates the typical distance of a data point from the mean of the data. If the standard deviation is relatively large, it means the data is quite spread out away from the mean. If the standard deviation is relatively small, it means the data is concentrated near the mean.
A realtor tells you that the average cost of houses in a town is $176,000. You want to know how much the prices of the houses may vary from this average. What measurement do you need?
(A) standard deviation
(B) interquartile range
(C) variance
(D) percentile
(E) Choice (A) or (C)
Answer: E. Choice (A) or (C) (standard deviation or variance)
The standard deviation is a way of measuring the typical distance that data is from the mean and is in the same units as the original data. The variance is a way of measuring the typical squared distance from the mean and isn't in the same units as the original data. Both the standard deviation and variance measure variation in the data, but the standard deviation is easier to interpret.
You take a random sample of ten car owners and ask them, "To the nearest year, how old is your current car?" Their responses are as follows: 0 years, 1 year, 2 years, 4 years, 8 years, 3 years, 10 years, 17 years, 2 years, 7 years. To the nearest year, what is the standard deviation of this sample?
Answer: 5 years
The formula for the sample standard deviation of a data set is

where x is a single value,
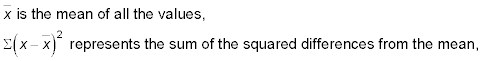
and n is the sample size.
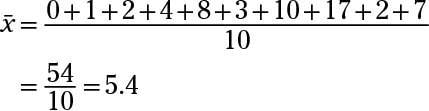
First, find the mean of the data set by adding together the data points and then dividing by the sample size (in this case, n = 10):
Then, subtract the mean from each number in the data set and square the differences,

(0 – 5.4)2 = (–5.4)2 = 29.16
(1 – 5.4)2 = (–4.4)2 = 19.36
(2 – 5.4)2 = (–3.4)2 = 11.56
(4 – 5.4)2 = (–1.4)2 = 1.96
(8 – 5.4)2 = (2.6)2 = 6.76
(3 – 5.4)2 = (–2.4)2 = 5.76
(10 – 5.4)2 = (4.6)2 = 21.16
(17 – 5.4)2 = (11.6)2 = 134.56
(2 – 5.4)2 = (–3.4)2 = 11.56
(7 – 5.4)2 = (1.6)2 = 2.56
Next, add up the results from the squared differences:
29.16 + 19.36 + 11.56 + 1.96 + 6.76 + 5.76 + 21.16 + 134.56 + 11.56 + 2.56 = 244.4
Finally, plug the numbers into the formula for the sample standard deviation:
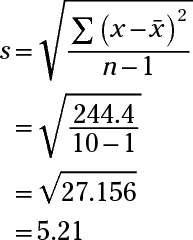
The question asks for the nearest year, so round to 5 years.
Two companies pay their employees the same average salary of $42,000 per year. The salary data in Ace Corp. has a standard deviation of $10,000, whereas Magna Company salary data has a standard deviation of $30,000. What, if anything, does this mean?
Answer: There is more variation in salaries in Magna Company than in Ace Corp.
The larger standard deviation in Magna Company shows a greater variation of salaries in both directions from the mean than Ace Corp. The standard deviation measures on average how spread out the data is (for example, the high and low salaries at each company).
Suppose that you're comparing the means and standard deviations for the daily high temperatures for two cities during the months of November through March.
Sunshine City:
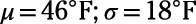
Lake Town:
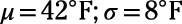
What's the best analysis for comparing the temperatures in the two cities?
Answer: Lake Town has a lower average temperature and less variability in temperatures than Sunshine City.
Lake Town has a much smaller standard deviation than Sunshine City, so its temperatures change (or vary) less. You don't know the actual range of temperatures for either city.
Everyone at a company is given a year-end bonus of $2,000. How will this affect the standard deviation of the annual salaries in the company that year?
Answer: There will be no change in the standard deviation.
All the data points will shift up $2,000, and as a result, the mean will also increase by $2,000. But each individual salary's distance (or deviation) from the mean will be the same, so the standard deviation will stay the same.
If you need more practice on this and other topics from your statistics course, visit 1,001 Statistics Practice Problems For Dummies to purchase online access to 1,001 statistics practice problems! We can help you track your performance, see where you need to study, and create customized problem sets to master your stats skills.