
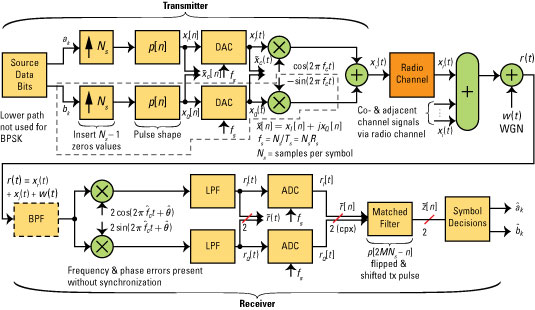
The block diagram is a hybrid of discrete-time and continuous-time signals and systems. When studying the performance of a digital communications scheme, working with the complex baseband, also known as complex envelope signals, is convenient.
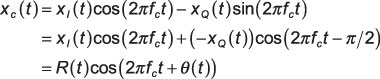
The IQ signal xc(t) has associated complex envelope,
To get this signal, rely on the extended version of the phasor addition formula:
Here, the complex envelope,
is given by
Note that you can get the original signal xc(t) by multiplying (spinning) the complex envelope by the complex sinusoid
Then taking the real part:
The block diagram performs this operation in the transmitter when the sine and cosine multiplier outputs are summed together.
The complex baseband/envelope signal, by definition, is centered in the frequency domain at f = 0. The simulation results are based on complex envelope modeling. The high frequency carrier doesn’t need to be generated in the simulation, so the sampling rate can be kept low, at just 10 times the bit (symbol) rate.
You can still model small carrier frequency offsets/errors and carrier phase errors. See, you can make good use of signals and systems knowledge for communication systems modeling.