The important IS–LM model shows how the economy responds to fiscal and monetary policy in the very short run (that is, when prices are fixed). The famous British economist John Hicks came up with it as a simple graphical representation of Keynes’s ideas in his General Theory. Here’s how it goes.
The economy is made up of two large markets:
Goods market: Where all goods and services are traded.
Money market: Where savers (people with spare money) meet borrowers (people who need money).
At any point in time these two markets should be in equilibrium: that is, the quantity of goods and services people want to buy should equal the quantity available to be sold; and the amount that people want to borrow should equal the amount that people want to save.
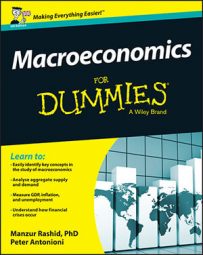
Equilibrium in the goods market is represented by the IS curve.
When the interest rate (r) is lower, goods market equilibrium requires output (Y) to be higher. This is because a lower interest rate stimulates consumption and investment demand, which are both components of output.
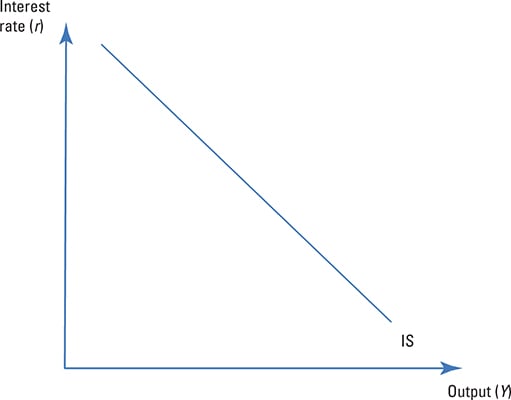
Equilibrium in the money market is represented by the LM curve.
When output (Y) is higher, money market equilibrium requires the interest rate (r) to be higher. This is because a higher level of output means that people are richer, which increases the demand for money, which in turn increases the interest rate, which is the ‘price of money’.
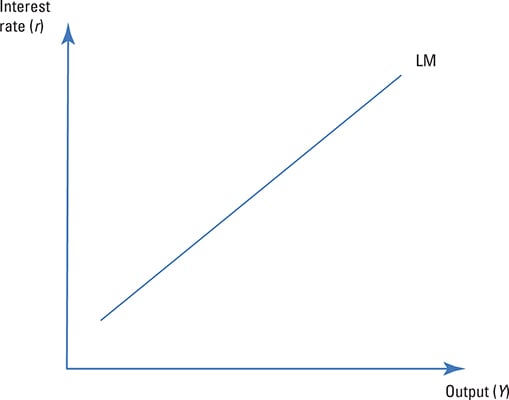
Putting the goods market and the money market together gives you this.
Notice that at interest rate r* and output Y*, the goods market and the money market are in equilibrium.
Expansionary fiscal policy (increasing government expenditure or reducing taxes) shifts the IS curve to the right, which increases output and the interest rate. Contractionary fiscal policy (reducing government expenditure or increasing taxes) shifts the IS curve to the left, which reduces output and the interest rate.
Similarly, expansionary monetary policy (increasing the money supply) shifts the LM curve to the right, increasing output and reducing the interest rate. Contractionary monetary policy (reducing the money supply) shifts the LM curve to the left, reducing output and increasing the interest rate.
Play around with the curves to see for yourself!