A variety of variables (26 in all) are stored by TI-Nspire after a regression. To view this list, add a Calculator page and press [VAR]. Using the
keys, you can scroll through this list and paste a variable into the entry line on the Calculator page.
For example, the second screen shows the variable stat.resid pasted to the entry line. Press [ENTER] to view a list of residuals. This list represents the difference between the y-value of each data point and the corresponding y-value associated with the regression equation.
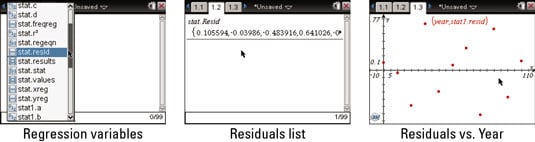
It might be interesting to inspect a scatter plot of the residuals as a function of the year. This plot visually shows the difference between the y-value of each data point and the corresponding y-value associated with the regression equation.
To construct this scatter plot, use the same methods just described. Let year be the variable used for X List and stat.resid be the variable used for Y List. The graph of this scatter plot is shown in the third screen. A perfect-fit regression places the residuals directly on the x-axis because no variation exists between the regression model and the data points.
Referring to the first screen, you see several other statistical variables generated from this cubic regression. For example, the variable stat.results, when executed on a Calculator page, displays a list of all the regression results pasted into columns D and E when the cubic regression was first performed on the Lists & Spreadsheet page.