Images on a graph screen have another purpose that is now a built-in tool! You can use Quick Plot & Fit Equation on your TI-84 Plus to quickly plot points directly on your graph and perform a regression on the points you so quickly plotted.
Load a background image and set an appropriate graphing window.
To locate Quick Plot & Fit–EQ, press

See the first screen.
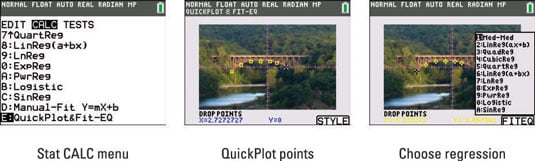
Press [ENTER] to activate Quick Plot & Fit–EQ.
Use the arrow keys to navigate your cursor, press [ENTER] to plot a point, and repeat until you have enough points for a regression.
See the second screen.
You need at least two points for a linear regression, at least three points for a quadratic regression, and so on.
Press [GRAPH] to activate the FITEQ on-screen prompt.
See the third screen.
Use the up- and down-arrow keys to navigate to the regression you want and press [ENTER].
See the first screen.
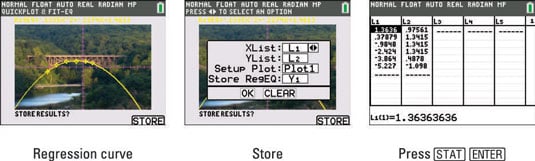
Press [GRAPH] to activate the STORE on-screen prompt.
See the second screen.
Use the arrow keys to navigate the menu spinners and press [ENTER] or OK to store.
You are storing two lists, one stat plot, and one equation. See the list in the third screen. Now that the regression equation is stored, you can trace and analyze the graph of the regression equation as much as you desire.