


You will need to know some quantitative risk analysis techniques for the PMP Certification Exam. It is also a good idea to familiarize yourself with the following definitions to fully understand quantitative risk analysis.
Sensitivity analysis. A quantitative risk analysis and modeling technique used to help determine which risks have the most potential impact on the project. It examines the extent to which the uncertainty of each project element affects the objective being examined when all other uncertain elements are held at their baseline values. The typical display of results is in the form of a tornado diagram.
Expected Monetary Value (EMV) analysis. A statistical technique that calculates the average outcome when the future includes scenarios that may or may not happen. A common use of this technique is within decision tree analysis.
Decision tree analysis. A diagramming and calculation technique for evaluating the implications of a chain of multiple options in the presence of uncertainty.
Simulation. A simulation uses a project model that translates the uncertainties specified at a detailed level into their potential impact on objectives that are expressed at the level of the total project. Project simulations use computer models and estimates of risk, usually expressed as a probability distribution of possible costs or durations at a detailed work level, and are typically performed by using Monte Carlo analysis.
Sensitivity analysis
You use a sensitivity analysis to see which variables have most impact on a project objective. You can develop what-if models or simulations to see the impact of a risk on either the budget or the schedule. Many times, the outcomes are graphed in a tornado diagram.
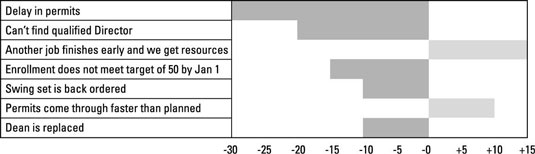
A tornado diagram has the following characteristics:
The longer the bar, the more sensitive the project objective is to the risk.
The risks are presented in descending order, with the largest impact on the top and the least impact on the bottom.
It allows the team to focus on those risks with the greatest impact on a project objective.
A tornado diagram isn’t the only way you can display information, but it is a common choice.
Expected Monetary Value (EMV)
To determine the expected monetary value of a risk or a decision, do the following:
Identify the scenarios that could occur.
Determine the probability of each scenario.
Determine the monetary value associated with each outcome.
Multiply the probability times the monetary value of each outcome.
Sum the outcomes to get the expected monetary value of the risk or decision.
Note that none of the scenarios might occur: You’re simply trying to get an average outcome given the uncertainty of the environment.
| Risk Event Alternative | Probability | Cost | Expected Monetary Value (EMV) |
|---|---|---|---|
| Keep staff | 50% | $172,000 | $86,000 |
| Lose staff | 50% | $208,000 | $104,000 |
| Expected Monetary Value | $190,000 |
If you purchase ready-made software, though, you have risk related to customization. There is a 60% chance that you will have to do only a little customization, which would bring the total cost to $152,000. And there is a 40% chance that you will have to do a lot of customization, which would bring the total cost to $188,000. To calculate the expected value, add the values of each alternative.
| Risk Event Alternative | Probability | Cost | Expected Value |
|---|---|---|---|
| Little customization | 60% | $152,000 | $91,200 |
| Much customization | 40% | $188,000 | $75,200 |
| Expected Monetary Value | $166,400 |
Your decision would be to purchase software because the cost is lower. As you can see, EMV can be calculated easily in a spreadsheet or a table. More often, it is displayed as a decision tree.
Decision tree
Here is the same information, but it depicted graphically.
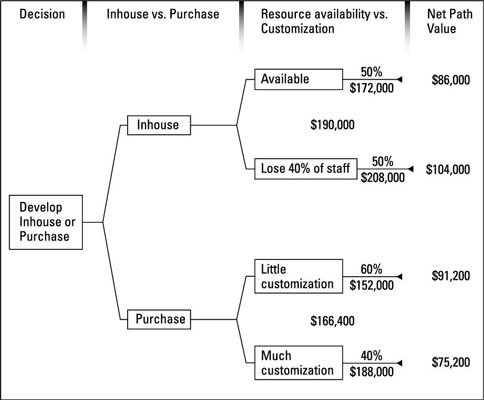
A decision tree is a simple way to get a visual display of the uncertainty and the various decision options for project risks.
Simulation
Most risk simulations use software to run thousands of possible iterations and come up with a probability distribution of the results. Here are the steps involved.
Start with multiple estimates (optimistic, pessimistic, and most likely) for each work package and enter them into the software.
Assume duration estimates for our example.
Enter the number of iterations you want the software to run.
Usually, 1,000–5,000 is sufficient without becoming overkill.
Run the simulation.
The computer takes random amounts from the range of duration estimates for each work package and produces a probability distribution.
Analyze the information.
The data show the likelihood of hitting a particular schedule target and tell you how much time you need to achieve 80% confidence.
Monte Carlo simulation. A process that generates hundreds or thousands of probable performance outcomes based on probability distributions for cost and schedule on individual tasks. The outcomes are then used to generate a probability distribution for the project as a whole.
![[Credit: Courtesy of Pritchard Management Associates, Frederick, MD.]](https://cdn.prod.website-files.com/6634a8f8dd9b2a63c9e6be83/669b5da379f070f89cb92625_401139.image2.jpeg)
The x-axis shows the total duration in days. For this example, the duration range is 23–37 days.
The y-axis on the left shows the number of occurrences a specific total duration occurred. You use this axis with the bars that indicate the number of times the simulation showed the duration of a specific number of days. Rarely was the duration 23 days or 27 days. There were more than 140 instances when the duration was 30 days.
The y-axis on the right shows the cumulative likelihood that a cumulative duration will occur. Use this with the line that indicates the cumulative likelihood the total duration will come in at or under a specified duration.
You can see the line intersects the bar for 30 days at the 50% likelihood point. This is the expected duration: 50% of the time, the duration will be greater than 30 days; 50% of the time, it will be less than 30 days.
If you were using this information to determine the amount of time you needed for the work and you wanted an 80% confidence rating, you would select 32 days.

