
In Excel, making charts is most of the work, but that's not all of it. You still have to decide where to put the charts. First, you need to figure out whether to put a chart on a separate chart sheet. That's nice and easy — you don't have to consider anything else, such as the size, or whether other charts, text, or numbers are nearby.
Your other option is to place a chart smack-dab in the middle of a worksheet. You may wonder why anyone would want to do that. Actually, putting a chart in the middle of a worksheet seems to be the preferred way to go. More decisions are involved, such as how large or how small the chart should be, and where on the worksheet it should go. But these options give you the power to align your chart next to supporting information.
The chart location choice is on the last screen (Step 4) of the Chart Wizard, as shown in Figure 1. It's interesting to note that of the two choices, the Chart Wizard defaults to placing the chart on a worksheet, not a separate chart sheet. The wizard must know something!
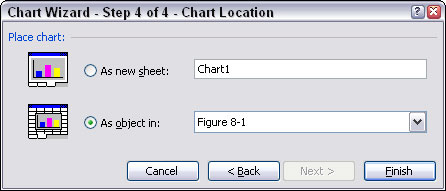
Figure 1: Deciding where to put the chart.
Placing charts on separate chart sheets
To place a new chart on a separate chart sheet, you just select the As New Sheet option in the last step of the Chart Wizard. You can accept the name supplied by the Chart Wizard, or you can enter your own. The supplied names are functional, such as Chart1, but not specific to your chart or data. Entering your own name isn't a bad idea.
Chart sheets aren't the same as worksheets. A chart sheet only displays a chart. There are no cells, and you can't enter any data on one.
Placing charts on separate chart sheets is great for getting a fast, full-sized chart, as shown in Figure 2. Note in the figure that the chart tab on the bottom is the name entered for the chart sheet. The name of the chart in the last step of the Chart Wizard — whether it's the one supplied by Excel or your own entered name — becomes the sheet name on the tab.
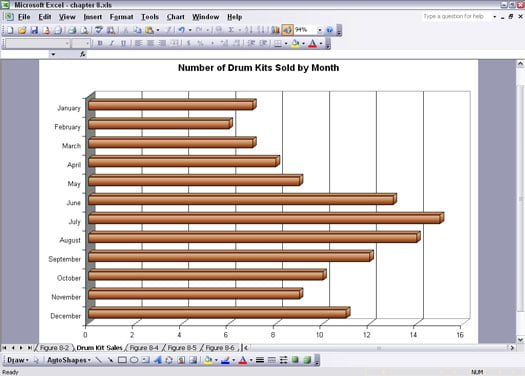
Figure 2: Viewing a chart on a chart sheet.
Here's what you need to do to place a chart on a chart sheet:
1. Enter some data on a worksheet.
If you want, you can use some good data you want to plot, but for this exercise any old data will do.
2. Click the Chart Wizard button on the Standard toolbar or choose Insert --> Chart.
The Chart Wizard opens.
3. Click the Next button three times.
4. In the last step of the Chart Wizard, select the As New Sheet option.
If you want, change the name.
5. Click Finish.
You now have a chart on a separate chart sheet.
6. Click the Print Preview button on the Standard toolbar or choose File --> Print Preview.
Now you can see how your chart will look when it prints.
You can use the Page Setup feature to make some alterations. While still in Print Preview, click the Setup button. On the Page tab in the Page Setup dialog box, you can set up your chart in either Portrait (vertical) or Landscape (horizontal) orientation. Figure 3 shows how a chart looks in Portrait view.
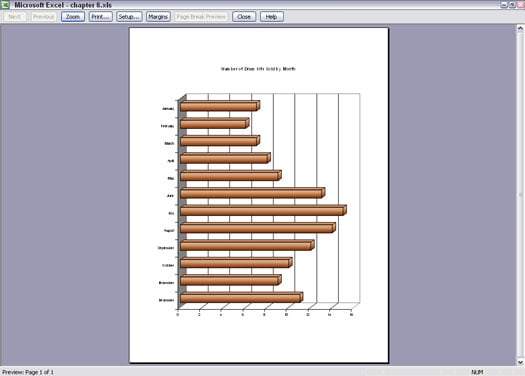
Figure 3: Viewing the chart in a different orientation.
What if you have a chart on a separate chart sheet, but you wish it were placed on a worksheet. Not to fear, the designers of Excel thought of everything. Here's what you do:
1. If you're still in Print Preview mode, click the Close button.
2. Choose Chart --> Location, or right-click on the chart and choose Location from the pop-up menu.
The Chart Location dialog box appears. It resembles the last step of the Chart Wizard.
3. Select the As Object In option, and select the worksheet from the drop-down list.
4. Click OK.
Placing charts on worksheets
Placing charts on worksheets has some advantages:
- They can be easily resized.
- They can be strategically placed near related information.
- You can put multiple charts on a worksheet.
The way to place a new chart on a worksheet is to select the As Object In option in the last step of the Chart Wizard.
Charts that are placed on worksheets seem to not have names. Actually, they are named, but the name is irrelevant to placing and manipulating the chart on a worksheet. The chart names do come in handy when using VBA to work with charts.
Figure 4 shows one of the reasons placing charts on worksheets is so popular. In this illustration, six charts, one per month, are placed together to convey comprehensive information. Placing charts together in this fashion is possible only with charts placed on worksheets.
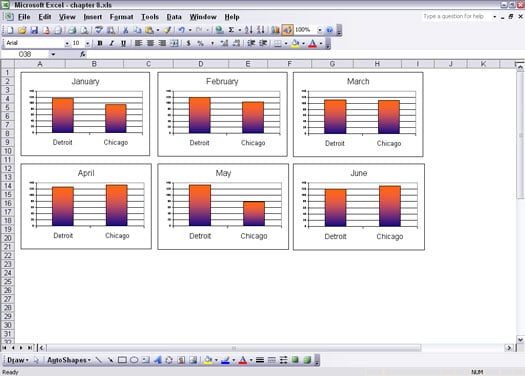
Figure 4: Placing charts where you want them on a worksheet.
Here's how to take a chart that is on a worksheet and place it on a separate chart sheet:
1. Select the chart by clicking on it once.
2. Choose Chart --> Location, or right-click on the chart and choose Location from the pop-up menu.
The Chart Location dialog box appears. It resembles the last step of the Chart Wizard.
3. Select the As New Sheet option.
You can accept the supplied name or enter one of your own.
4. Click OK.