
By default, Excel 2010 uses the SUM function to create subtotals and grand totals for the numeric field(s) that you include in a pivot table. Some pivot tables, however, require the use of another summary function, such as AVERAGE or COUNT.
To change the summary function that Excel uses in a pivot table, follow these steps:
Double-click the Sum Of field label that's located at the cell intersection of the first Column and Row Field in a pivot table.
Excel opens the Value Field Settings dialog box for that field.
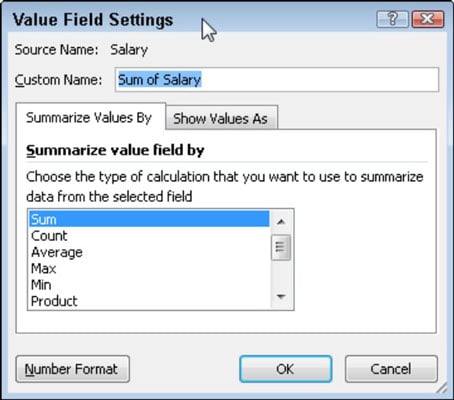 Select a new summary function in the Value Field Settings dialog box.
Change the field's summary function to any of the following functions by selecting it in the Summarize Value Field By list box:
Count to show the number of records for a particular category (note that Count is the default setting for any text fields that you use in a pivot table).
Average to calculate the average (that is, the arithmetic mean) for the values in the field for the current category and page filter.
Max to display the highest numeric value in that field for the current category and page filter.
Min to display the lowest numeric value in that field for the current category and page filter.
Product to multiply all the numeric values in that field for the current category and page filter (all non-numeric entries are ignored).
Count Numbers to display the number of numeric values in that field for the current category and page filter (all non-numeric entries are ignored).
StdDev to display the standard deviation for the sample in that field for the current category and page filter.
StdDevp to display the standard deviation for the population in that field for the current category and page filter.
Var to display the variance for the sample in that field for the current category and page filter.
Varp to display the variance for the population in that field for the current category and page filter.
Click OK.
Excel applies the new function to the data present in the body of the pivot table.