


The window settings clearly do not effectively reveal the graph on the TI-Nspire. The x-values of the function represent the width of the rectangle, and the y-values represent the area. The y-values are positive. Therefore, it makes sense to focus on the first quadrant only.
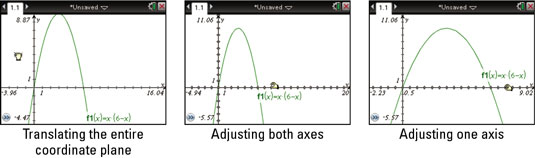
To grab the entire coordinate plane, move the cursor to some open space and press [CTRL][CLICK]. You see the crunched up paper symbol with a hand, indicating that the entire coordinate plane can be translated in any direction. Use the Touchpad keys to move the graph so that the origin is located in the lower-left corner of the screen. Press [ESC] to release the coordinate plane.
Unfortunately, the maximum point on the parabola is still not in view. TI-Nspire allows you to grab the tick marks on the axes themselves to change these end values. Here’s how:
Move the cursor over the x-axis. Both axes start to pulse, and the word axes appears on the screen.
If another object (like text) gets in the way of finding the x-axis, press [TAB] to cycle through and find any layered objects.
Press [CTRL][CLICK] to grab both axes.
Press the Touchpad keys to drag the tick marks. Moving away from the origin zooms out. Moving toward the origin zooms in.
Press [ESC] when the vertex of the parabola comes into view.
Perhaps you want to adjust the scale of the x-axis only to completely fill the space in the work area with your graph. Follow these steps to do so:
Move the cursor over the x-axis. Again, both axes start to pulse, and the word axes appears on the screen.
Press [CTRL][CLICK] to grab both axes.
Press and hold [SHIFT] as you press the Touchpad keys to drag the tick marks, moving toward the origin to decrease the scale of only the x-axis and moving away from the origin to increase the scale of only the x-axis.
Press [ESC] to release the x-axis.
The last two screens show the result of dragging both axes and a single axis, respectively.
Here are two more options that can be used to adjust the window settings:
Move the cursor to an axis end value (assuming that it’s in view) and press [CLICK] twice to highlight the current end value. Type a new end value and press [ENTER] to put the change into effect. To edit all four end values one after the other, don’t press [ENTER] after changing an end value. Instead, press [TAB] to rotate in a clockwise manner to the next end value.
Press [MENU]→Window/Zoom→Window Settings. This action opens a dialog box and enables you to type your minimum and maximum end values as well as the scale. Press [ENTER] to put the changes into effect.

