
On the TI-Nspire, you can create box plots. Consider that you want to investigate the major-league home run leaders between the years of 1988 and 2002. Although this topic is somewhat controversial, from a data standpoint, the results are quite interesting!
In the first screen, enter the data in column A (named al for American League) and column B (named nl for National League). If you want to enter all the data, take a peek at the second and third screens to see the rest of the data in columns A and B. Then press [MENU]→Data→Quick Graph and, by default, obtain a dot plot for the American League data.
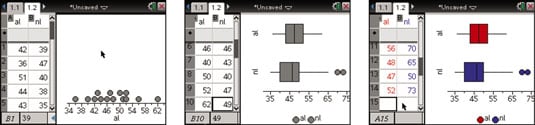
Press [MENU]→Plot Type→Box Plot to switch from a dot plot to a box plot. It is cool to watch the points dynamically move and morph into the new plot every time it happens!
As you move the cursor over the box plot, each of the values that comprise the five-number summary are revealed. If you click one of the four regions in a box plot, the individual data points are revealed. Keep in mind that multiple occurrences of the same number are displayed as a single point. To hide points, move to an open space on the screen and press [CLICK].