After you have used your TI-84 Plus to graph your functions and create a table of functional values, you can view the graph and the table on the same screen. To do so, follow these steps:
Press [MODE].
Put the calculator in Graph-Table mode.
To do so, use the arrow keys to place the cursor on Graph-Table in the ninth line of the Mode menu, and then press [ENTER] to highlight it. This is illustrated in the first screen.
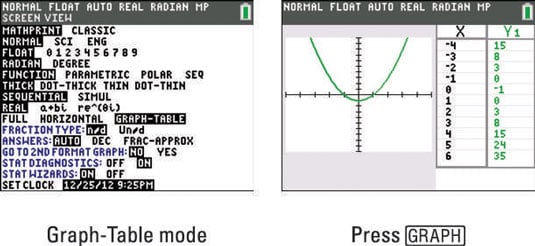
Press [GRAPH].
After you press [GRAPH], the graph and the table appear on the same screen (as shown in the second screen).
If you press any key used in graphing functions, such as [GRAPH] or [TRACE], the cursor becomes active on the graph side of the screen. To return the cursor to the table, press [2nd][GRAPH]. See the first screen.
In Graph-Table mode, only one function will display in the table at a time. If you have more than one function graphed, press the right-arrow key to see additional table values. For this to work, your cursor must be on the table side of the screen.
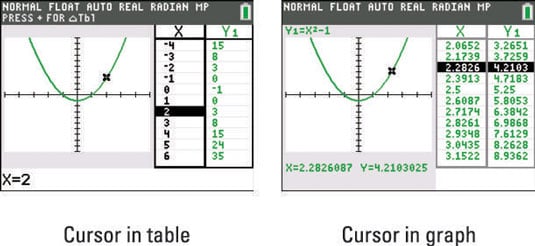
If you press [TRACE] and then use the arrow keys to trace the graph, the value of the independent variable x corresponding to the cursor location on the graph is highlighted in the table and the column for the function you’re tracing appears next to it. If necessary, the calculator updates the table so you can see that row in the table.
Press [WINDOW] to change your TraceStep settings. When your cursor is on the graph side of the screen, your table values are determined by your TraceStep, as shown in the second screen.
To view the graph or the table in full screen mode, you can use these steps:
Press [MODE].
Put the calculator in Full screen mode.
To do so, use the arrow keys to place the cursor on Full in the bottom-left corner of the Mode menu and press [ENTER] to highlight it.
Press [GRAPH] to see the graph, or press [2nd][GRAPH] to see the table.