To perform regression analysis by using the Data Analysis add-in, do the following:
-
Tell Excel that you want to join the big leagues by clicking the Data Analysis command button on the Data tab.
-
When Excel displays the Data Analysis dialog box, select the Regression tool from the Analysis Tools list and then click OK.
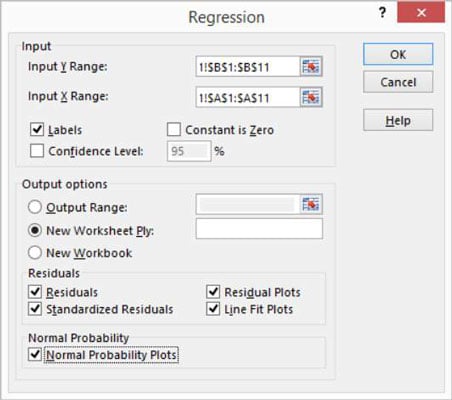
Excel displays the Regression dialog box.
-
Identify your Y and X values.
Use the Input Y Range text box to identify the worksheet range holding your dependent variables. Then use the Input X Range text box to identify the worksheet range reference holding your independent variables.
Each of these input ranges must be a single column of values. For example, if you want to use the Regression tool to explore the effect of advertisements on sales, you enter $A$1:$A$11 into the Input X Range text box and $B$1:$B$11 into the Input Y Range text box. If your input ranges include a label, select the Labels check box.
-
(Optional) Set the constant to zero.
If the regression line should start at zero — in other words, if the dependent value should equal zero when the independent value equals zero — select the Constant Is Zero check box.
-
(Optional) Calculate a confidence level in your regression analysis.
To do this, select the Confidence Level check box and then (in the Confidence Level text box) enter the confidence level you want to use.
-
Select a location for the regression analysis results.
Use the Output Options radio buttons and text boxes to specify where Excel should place the results of the regression analysis. To place the regression results into a range in the existing worksheet, for example, select the Output Range radio button and then identify the range address in the Output Range text box. To place the regression results someplace else, select one of the other option radio buttons.
-
Identify what data you want returned.
Select from the Residuals check boxes to specify what residuals results you want returned as part of the regression analysis.
Similarly, select the Normal Probability Plots check box to add residuals and normal probability information to the regression analysis results.
-
Click OK.
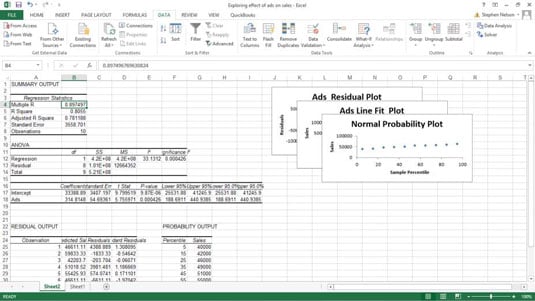
Excel shows a portion of the regression analysis results including three, stacked visual plots of data from the regression analysis.
There is a range that supplies some basic regression statistics, including the R-square value, the standard error, and the number of observations. Below that information, the Regression tool supplies analysis of variance (or ANOVA) data, including information about the degrees of freedom, sum-of-squares value, mean square value, the f-value, and the significance of F.
Beneath the ANOVA information, the Regression tool supplies information about the regression line calculated from the data, including the coefficient, standard error, t-stat, and probability values for the intercept — as well as the same information for the independent variable, which is the number of ads. Excel also plots out some of the regression data using simple scatter charts.