How to Use the Database Functions in Excel 2013
Excel 2013 includes a number of database functions that you can use to calculate statistics, such as the total, average, maximum, minimum, and count in a particular field of the data list only when the criteria that you specify are met.
For example, you could use the DSUM function in an Employee data list to compute the sum of all the salaries for employees who were hired after January 1, 2000, or you could use the DCOUNT function to compute the number of records in the data list for the Human Resources department.
The database functions, regardless of the difference in names (and they all begin with the letter D) and the computations that they perform, all take the same three arguments as illustrated by the DAVERAGE function:
DAVERAGE(database,field,criteria)
The arguments for the database functions require the following information:
database is the argument that specifies the range containing the list and it must include the row of field names in the top row.
field is the argument that specifies the field whose values are to be calculated by the database function (averaged in the case of the DAVERAGE function). You can specify this argument by enclosing the name of the field in double quotes (as in "Salary" or "Date Hired"), or you can do this by entering the number of the column in the data list (counting from left to right with the first field counted as 1).
criteria is the argument that specifies the address of the range that contains the criteria that you’re using to determine which values are calculated. This range must include at least one field name that indicates the field whose values are to be evaluated and one cell with the values or expression to be used in the evaluation.
Note that in specifying the field argument, you must refer to a column in the data list that contains numeric or date data for all the database functions with the exception of DGET. All the rest of the database functions can’t perform computations on text fields.
If you mistakenly specify a column with text entries as the field argument for these database functions, Excel returns an error value or 0 as the result. The table lists the various database functions available in Excel along with an explanation of what each one calculates. (You already know what arguments each one takes.)
The Database Functions in Excel
| Database Function |
What It Calculates |
| DAVERAGE |
Averages all the values in a field of the data list that match
the criteria you specify. |
| DCOUNT |
Counts the number of cells with numeric entries in a field of
the data list that match the criteria you specify. |
| DCOUNTA |
Counts the number of nonblank cells in a field of the data list
that match the criteria you specify. |
| DGET |
Extracts a single value from a record in the data list that
matches the criteria you specify. If no record matches, the
function returns the #VALUE! error value. If multiple records
match, the function returns the #NUM! error value. |
| DMAX |
Returns the highest value in a field of the data list that
matches the criteria you specify. |
| DMIN |
Returns the lowest value in a field of the data list that
matches the criteria you specify. |
| DPRODUCT |
Multiplies all the values in a field of the data list that
match the criteria you specify. |
| DSTDEV |
Estimates the standard deviation based on the sample of values
in a field of the data list that match the criteria you
specify. |
| DSTDEVP |
Calculates the standard deviation based on the population of
values in a field of the data list that match the criteria you
specify. |
| DSUM |
Sums all the values in a field of the data list that match the
criteria you specify. |
| DVAR |
Estimates the variance based on the sample of values in a field
of the data list that match the criteria you specify. |
| DVARP |
Calculates the variance based on the population of values in a
field of the data list that match the criteria you specify. |
The Database functions are too rarely used to rate their own command button on the Ribbon’s Formulas tab. As a result, to use them in a worksheet, you must click the Function Wizard (fx) button on the Formula bar and then select Database from the Select a Category drop-down list box and then click the function to use or type the Database function directly into the cell.
Cell C2 in the worksheet shown in this figure contains the following formula:
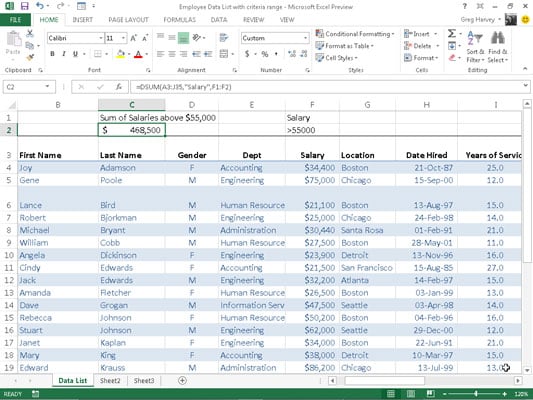
=DSUM(A3:J35,"Salary",F1:F2)
This DSUM function computes the total of all the salaries in the data list that are above $55,000. This total is $468,500, as shown in cell C2, which contains the formula.
To perform this calculation, specify the range A3:J35, which contains the entire data list. This range includes the top row of field names as the database argument (which Excel 2013 automatically converted to its range name equivalent, Table2[#All]).
Then specify "Salary" as the field argument of the DSUM function because this is the name of the field that contains the values that you want totaled. Finally, specify the range E1:E2 as the criteria argument of the DSUM function because these two cells contain the criteria range that designate that only the values exceeding 55000 in the Salary field are to be summed.

Excel Glossary
active cell
The worksheet cell that contains the cell cursor. Each worksheet can have only one active cell.

Excel Glossary
AutoComplete
A feature that looks at the entries that you make in a worksheet column and automatically duplicates them in subsequent rows whenever you start a new entry that begins with the same letter or letters as an existing entry in that column.

Excel Glossary
AutoCorrect
A feature that alerts Excel 2007 to common typing errors and your own typing errors (that you specify) and tells the program how it should automatically fix them for you.

Excel Glossary
AutoFill
An Excel 2007 feature that quickly creates a series of entries based on the data you enter in one or two cells. AutoFill works with days of the week, months of the year, yearly quarters; consecutive series of numbers; and formulas. You also can add your own custom AutoFill series.

Excel Glossary
AutoFilter
A feature in Excel 2010 that enables you to temporarily hide everything in a table except the records you specifically want to view, based on criteria you specify.

Excel Glossary
Backstage view
A new feature in Excel 2010 — accessible from the green File tab — that enables you to manage files and to view the properties and stats about the workbook file you're editing.

Excel Glossary
cell
The intersection of a column and row in the worksheet.

Excel Glossary
cell address
The cell identifier, determined by its column letter(s) followed by the row number, as in cell A1, the very first cell of each worksheet at the intersection of column A and row 1.

Excel Glossary
cell cursor
The black border that surrounds the active cell in a worksheet.

Excel Glossary
clip art
Readymade drawings, illustrations, and photos offered by Microsoft for use in Microsoft Office applications.

Excel Glossary
Compatibility Checker
A utility in Excel 2007 and 2010 that you use to find potential compatibility issues if you plan to save an Excel workbook file in the older Excel 97–2003 file format.

Excel Glossary
current cell
The worksheet cell that contains the cell cursor. Each worksheet can have only one current cell.

Excel Glossary
data table
A range of cells in a worksheet in which you enter a series of possible values that Excel plugs into a formula so you can perform what-if analysis on the data.

Excel Glossary
dialog box
A rectangular window with settings and commands that appears when you click a dialog box launcher or certain other commands on the Ribbon.

Excel Glossary
dialog box launcher
A small icon in the lower-right corner of a group of command buttons on the Ribbon that you click to access a dialog box with additional related settings and commands.

Excel Glossary
function
A part of a formula that takes a number of specific arguments and then returns a single value based on those arguments.

Excel Glossary
gallery
A drop-down list of thumbnail selections that appears when you click certain command buttons on the Ribbon.

Excel Glossary
group
A section of a tab on the Excel 2007 Ribbon that organizes related command buttons into subtasks normally performed as part of the tab's larger core task. The name of a group appears at the bottom of the group, such as the Font group on the Home tab.

Excel Glossary
hyperlink
Specially formatted text that anyone can click to jump to Web sites, move to other cells or workbooks, or create an e-mail message.

Excel Glossary
keyboard shortcuts
A combination of keys that you can press to execute certain commands, as opposed to finding and clicking the commands' buttons on the Ribbon or elsewhere.

Excel Glossary
Live Preview
A feature in Excel 2007 that enables you to point to thumbnails on a drop-down gallery to see how a new font, font size, table style, or cell style would look on your selected data before you actually apply it.

Excel Glossary
macro
A series of commands or actions in Excel that are recorded and saved together in a file. You can run the macro whenever you need to perform the task.

Excel Glossary
Name box
The left-most section of the Formula bar that displays the address or name of the current cell.

Excel Glossary
pivot table
A special type of table unique to Excel 2007 that enables you to summarize large amounts of data and pivot or rearrange the table's data to display different summaries of the information it contains.

Excel Glossary
Ribbon
A new feature of the Excel 2007 interface that replaces the menus and toolbars of previous versions; appears at the top of the Excel window, just below the title bar.

Excel Glossary
ScreenTip
A small window that displays descriptive text when you point to but don't click a command on the Ribbon or other objects in a worksheet.

Excel Glossary
sheet tabs
Small tabs near the bottom of a worksheet that you click to move between the worksheets in a workbook. You can assign descriptive names to sheet tabs.

Excel Glossary
slicers
New graphic objects in Excel 2010 that enable you to quickly filter the contents of a PivotTable on more than one field.

Excel Glossary
SmartArt
A type of graphic object in Excel 2007 that gives you the ability to quickly and easily construct graphical lists and diagrams in the worksheet.

Excel Glossary
sparklines
Tiny graphs (miniature charts) that fit within a single cell in the worksheet, used to show basic trends in data.

Excel Glossary
Status bar
A horizontal bar that appears at the bottom of the Excel 2007 window and keeps you informed of Excel's current mode. In addition, you can use the Status bar to select a new worksheet view and to zoom in and out on the worksheet.

Excel Glossary
tabs
The various "pages" of Excel 2007's Ribbon interface that you click to display command buttons relating to the tab's name, such as Page Layout and Formulas.

Excel Glossary
template
A pre-designed worksheet that can be used as a basis for creating new worksheets.

Excel Glossary
WordArt
Stylized text objects that you use to add pizzazz and emphasis to headings and other text in Excel 2007 worksheets.

Excel Glossary
workbook
The basic file type that you create when you use Excel 2007. A new workbook consists of three worksheets by default.

Excel Glossary
worksheet
The main document that you work in when you enter data into cells within Excel 2007. A worksheet is stored in a workbook file.

Excel Glossary
worksheet area
The portion of an Excel 2007 worksheet in which you enter cell data and add objects such as charts and graphics.

Excel Glossary
XPS XML Paper Specification
A file format developed by Microsoft that enables people to open and print documents in XPS Reader without access to the original programs with which the documents were created (such as Excel).

Excel Glossary
Zoom slider
An object on the Status bar in Excel 2007 that enables you to increase the magnification in a worksheet or shrink it down to get an overall picture of the worksheet data.