
A decision tree is an approach to predictive analysis that can help you make decisions. Suppose, for example, that you need to decide whether to invest a certain amount of money in one of three business projects: a food-truck business, a restaurant, or a bookstore.
A business analyst has worked out the rate of failure or success for each of these business ideas as percentages and the profit you’d make in each case.
| Business | Success Rate | Failure Rate |
|---|---|---|
| Food Truck | 60 percent | 40 percent |
| Restaurant | 52 percent | 48 percent |
| Bookstore | 50 percent | 50 percent |
| Business | Gain (USD) | Loss (USD) |
|---|---|---|
| Food Truck | 20,000 | -7,000 |
| Restaurant | 40,000 | -21,000 |
| Bookstore | 6,000 | -1,000 |
From past statistical data shown, you can construct a decision tree as shown below.
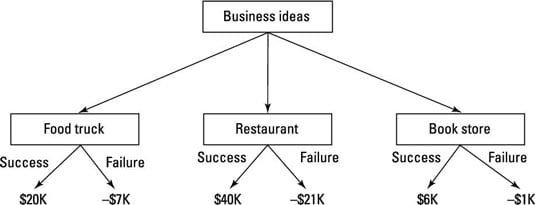
Using such a decision tree to decide on a business venture begins with calculating the expected value for each alternative — a numbered rank that helps you select the best one.
The expected value is calculated in such a way that includes all possible outcomes for a decision. Calculating the expected value for the food-truck business idea looks like this:
Expected value of food-truck business = (60 percent x 20,000 (USD)) + (40 percent * -7,000 (USD)) = 9,200 (USD)
Here the expected value reflects the average gain from investing in a food-truck business. In this scenario — working with hypothetical numbers, of course — if you attempt to invest in food-truck businesses several times (under the same circumstances each time), your average profit will be 9,200 (USD) per business.
Accordingly, you can calculate the expected values of a restaurant business and bookstore the same way, as follows:
Expected value of restaurant business = (52 percent x 40,000 (USD)) + (48 percent * -21,000 (USD)) = 10,720 (USD)
Expected value of bookstore business = (50 percent x 6,000 (USD)) + (50 percent * -1,000 (USD)) = 2,500 (USD)
The expected value of a restaurant business represents a prediction of how much profit you’d make (on average) if you invested in a restaurant business several times. Therefore the expected value becomes one of the criteria you figure into your business decision-making. In this example, the expected values of the three alternatives might incline you to favor investing in the restaurant business.
Decision trees can also be used to visualize classification rules (such as those mentioned in the earlier example of the online watch store).
A decision algorithm generates a decision tree that represents classification rules. In the watch-store example, you want to predict whether a given customer will buy a watch from your store; the decision tree will be, essentially, a flow chart: Each node of the decision tree represents an attribute identified in the data matrix. The leaves of the tree are the predicted decisions.
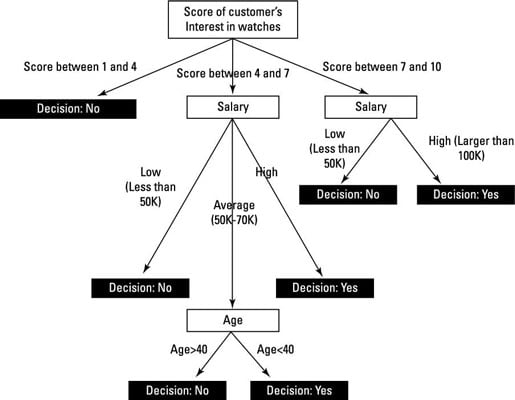
This decision tree predicts whether a customer might buy a given watch at the online store. The nodes in this decision tree represent some of the attributes you’re analyzing; each is a score — of customer interest in watches, customer age, and customer salary.
Applying the model to a new Customer X, you can trace a path from the root of the tree down to a decision tree’s leaf (yes or no) that indicates and maps how that customer would behave toward the watch being advertised.