


When you move a graph horizontally or vertically, this is called a translation. In other words, every point on the parent graph is translated left, right, up, or down. Translation always involves either addition or subtraction, and you can quickly tell whether it is horizontal or vertical by looking at whether the operation takes place within the parentheses of a function, or is completely separate from the function.
Shifting a graph horizontally
A number adding or subtracting inside the parentheses (or other grouping device) of a function creates a horizontal shift. Such functions are written in the form f(x – h), where h represents the horizontal shift.
The numbers in this function do the opposite of what they look like they should do. For example, if you have the equation g(x) = (x – 3)2, the graph of f(x)=x2 gets moved to the right three units; in h(x) = (x + 2)2, the graph of f(x)=x2 gets moved to the left two units.
Why does it work this way? Examine the parent function f(x) = x2 and the horizontal shift g(x) = (x – 3)2. When x = 3, f(3) = 32 = 9 and g(3) = (3 – 3)2 = 02 = 0. The g(x) function acts like the f(x) function when x was 0. In other words, f(0) = g(3). It’s also true that f(1) = g(4). Each point on the parent function gets moved to the right by three units; hence, three is the horizontal shift for g(x).
Try your hand at graphing
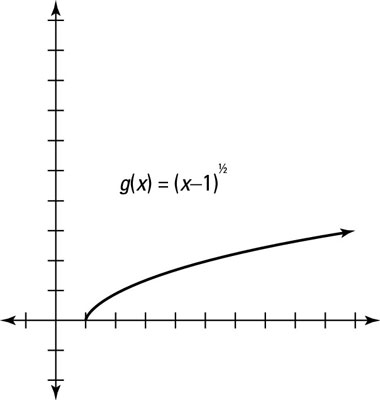
Because – 1 is underneath the square root sign, this shift is horizontal — the graph gets moved to the right one position. If
you’ll find that k(0) = g(1), which is to the right by one. The graph of the horizontal shift
is shown in this figure.
Shifting a graph vertically
Adding or subtracting numbers completely separate from the function causes a vertical shift in the graph of the function. Consider the expression f(x) + v, where v represents the vertical shift. Notice that the addition of the variable exists outside the function.
Vertical shifts are less complicated than horizontal shifts, because reading them tells you exactly what to do. In the equation f(x) = x2 – 4, you can probably guess what the graph is going to do: It moves the graph of y=x2 down four units, whereas the graph of g(x) = x2 + 3 moves the graph of y=x2 up three units.
Note: You see no vertical stretch or shrink for either f(x) or g(x), because the coefficient in front of x2 for both functions is 1. If another number multiplied with the functions, you’d have a vertical stretch or shrink before doing the vertical shift.
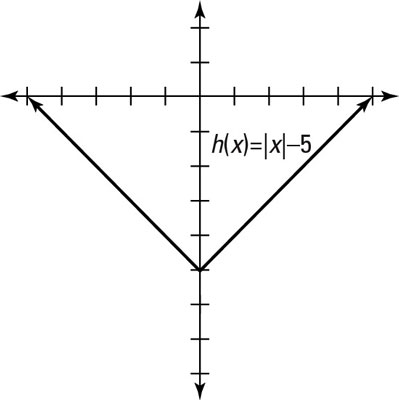
To graph the function h(x) = |x| – 5, notice that the vertical shift is down five units, as this figure shows.
