After you graph a function on your TI-84 Plus calculator, you can press [TRACE] and use the right-arrow and left-arrow keys to more closely investigate the function.
If you use only the
keys (called a free-moving trace) instead of [TRACE] to locate a point on a graph, all you will get is an approximation of the location of that point; you rarely get an actual point on the graph. So always use [TRACE] to identify points on a graph!
The following list describes what you see, or don’t see, as you trace a graph:
The definition of the function: The function you’re tracing is displayed in the top border of the screen, provided the calculator is in ExprOn format. If the Format menu is set to ExprOff and CoordOn, then the Y= editor number of the function appears in the border at the top right of the screen, followed by the definition of the function.
If the Format menu is set to ExprOff and CoordOff, then tracing the graph is useless because all you see is a cursor moving on the graph. The calculator won’t tell you the coordinates of the cursor location.
If you’ve graphed more than one function and you want to trace a different function, press the up-arrow or down-arrow keys. Each time you press one of these keys, the cursor jumps to another function. Eventually it jumps back to the original function.
The values of x and y: In the border at the bottom of the screen, you see the values of the x- and y-coordinates that define the cursor location. In the PolarGC format, the coordinates of this point display in polar form.
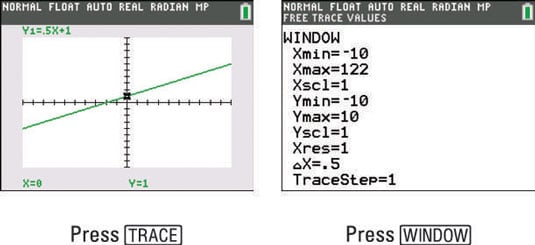
When you press [TRACE], the cursor is placed on the graph at the point having an x-coordinate that is approximately midway between Xmin and Xmax. See the first screen. If the y-coordinate of the cursor location isn’t between Ymin and Ymax, then the cursor doesn’t appear on the screen.
Each time you press the right-arrow key, the cursor moves right to the next plotted point on the graph, and the coordinates of that point are displayed at the bottom of the screen. If you press the left-arrow key, the cursor moves left to the previously plotted point.
And if you press the up- or down-arrow key to trace a different function, the tracing of that function starts at the point on the graph that has the x-coordinate displayed on-screen before you pressed this key.
Press [CLEAR] to terminate tracing the graph. This also removes the name of the function and the coordinates of the cursor from the screen.